如何在Matplotlib中反转颜色映射
Matplotlib是Python中最常用的绘图库,它提供了大量的绘图方法,可以满足各种绘图需求。在使用Matplotlib进行数据可视化时,我们经常需要使用颜色映射(colormap)来表示数据的大小。有时,我们可能需要反转颜色映射,以便更好地表示数据。本文将详细介绍如何在Matplotlib中反转颜色映射。
1. 什么是颜色映射(colormap)
在Matplotlib中,颜色映射(colormap)是一个从数值到颜色的映射。它通常用于将一个连续或离散的数值变量映射到颜色,以便在图形中表示数据的大小。例如,在一个热力图中,颜色映射可以用来表示数据的大小,深色表示大的数值,浅色表示小的数值。
Matplotlib提供了大量的预定义颜色映射,如’jet’、’viridis’、’plasma’等。每种颜色映射都有一个唯一的名称,我们可以通过这个名称来使用颜色映射。
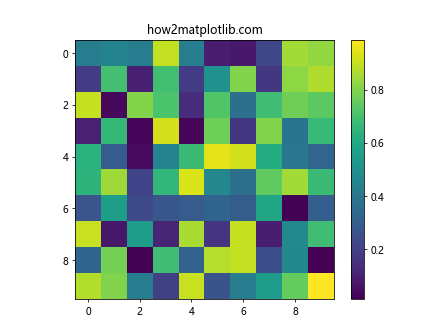
以下是一个使用’viridis’颜色映射的示例:
import matplotlib.pyplot as plt
import numpy as np

x = np.random.rand(10, 10)
plt.imshow(x, cmap='viridis')
plt.colorbar()
plt.title('how2matplotlib.com')
plt.show()
Output:

2. 如何反转颜色映射
在Matplotlib中,我们可以通过在颜色映射的名称后面添加’_r’来反转颜色映射。例如,’viridis_r’表示反转的’viridis’颜色映射。
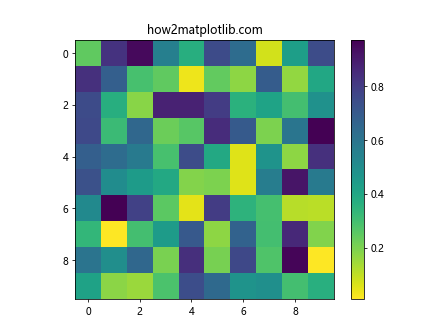
以下是一个反转颜色映射的示例:
import matplotlib.pyplot as plt
import numpy as np

x = np.random.rand(10, 10)
plt.imshow(x, cmap='viridis_r')
plt.colorbar()
plt.title('how2matplotlib.com')
plt.show()
Output:

在这个示例中,我们使用了反转的’viridis’颜色映射,因此深色表示小的数值,浅色表示大的数值。
3. 自定义颜色映射
除了使用Matplotlib提供的预定义颜色映射,我们还可以自定义颜色映射。自定义颜色映射可以让我们更灵活地控制颜色的分布。
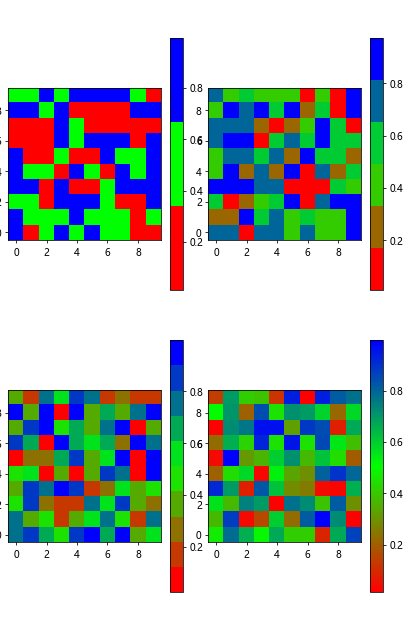
以下是一个自定义颜色映射的示例:
import matplotlib.pyplot as plt
import numpy as np
from matplotlib.colors import LinearSegmentedColormap

colors = [(1, 0, 0), (0, 1, 0), (0, 0, 1)]  # R -> G -> B
n_bins = [3, 6, 10, 100]  # Discretizes the interpolation into bins
cmap_name = 'how2matplotlib.com'
fig, axs = plt.subplots(2, 2, figsize=(6, 9))
fig.subplots_adjust(left=0.02, bottom=0.06, right=0.95, top=0.94, wspace=0.05)
for n_bin, ax in zip(n_bins, axs.ravel()):
    # Create the colormap
    cm = LinearSegmentedColormap.from_list(cmap_name, colors, N=n_bin)
    # Fewer bins will result in "coarser" colomap interpolation
    im = ax.imshow(np.random.random((10, 10)), interpolation='nearest', origin='lower', cmap=cm)
    fig.colorbar(im, ax=ax)
plt.show()
Output:

在这个示例中,我们首先定义了一个颜色列表,然后使用LinearSegmentedColormap.from_list方法创建了一个颜色映射。这个颜色映射将数值线性地映射到颜色。
4. 反转自定义颜色映射
和预定义颜色映射一样,我们也可以反转自定义颜色映射。反转自定义颜色映射的方法是在创建颜色映射时,将颜色列表反向。
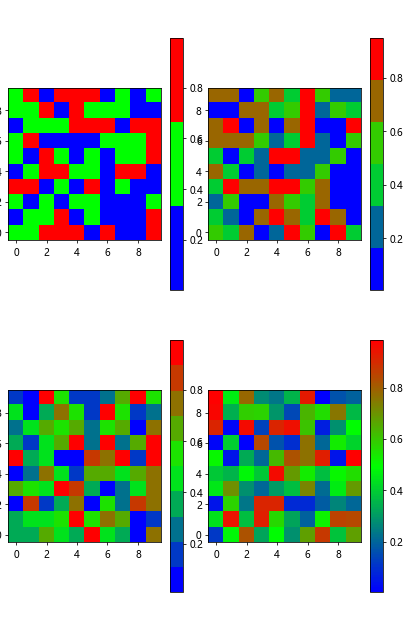
以下是一个反转自定义颜色映射的示例:
import matplotlib.pyplot as plt
import numpy as np
from matplotlib.colors import LinearSegmentedColormap

colors = [(1, 0, 0), (0, 1, 0), (0, 0, 1)]  # R -> G -> B
colors = colors[::-1]  # Reverse the color list
n_bins = [3, 6, 10, 100]  # Discretizes the interpolation into bins
cmap_name = 'how2matplotlib.com'
fig, axs = plt.subplots(2, 2, figsize=(6, 9))
fig.subplots_adjust(left=0.02, bottom=0.06, right=0.95, top=0.94, wspace=0.05)
for n_bin, ax in zip(n_bins, axs.ravel()):
    # Create the colormap
    cm = LinearSegmentedColormap.from_list(cmap_name, colors, N=n_bin)
    # Fewer bins will result in "coarser" colomap interpolation
    im = ax.imshow(np.random.random((10, 10)), interpolation='nearest', origin='lower', cmap=cm)
    fig.colorbar(im, ax=ax)
plt.show()
Output:

在这个示例中,我们首先将颜色列表反向,然后使用反向的颜色列表创建了一个颜色映射。这个颜色映射将数值线性地映射到颜色,但颜色的分布是反向的。
5. 结论
在Matplotlib中,我们可以通过在颜色映射的名称后面添加’_r’来反转颜色映射。此外,我们还可以自定义颜色映射,并通过反向颜色列表来反转自定义颜色映射。反转颜色映射可以让我们更灵活地表示数据,满足各种绘图需求。
 极客教程
极客教程