Matplotlib中如何旋转X轴刻度标签文本:全面指南
参考:How to Rotate X-Axis Tick Label Text in Matplotlib
Matplotlib是Python中最流行的数据可视化库之一,它提供了丰富的功能来创建各种类型的图表和绘图。在使用Matplotlib创建图表时,我们经常需要调整X轴刻度标签的方向,以便更好地显示长文本或避免标签重叠。本文将详细介绍如何在Matplotlib中旋转X轴刻度标签文本,包括多种方法和技巧,以及如何处理不同的场景和需求。
1. 基本方法:使用plt.xticks()
最简单的旋转X轴刻度标签的方法是使用plt.xticks()函数。这个函数允许我们设置刻度的位置、标签文本以及旋转角度。
import matplotlib.pyplot as plt
import numpy as np

x = np.arange(5)
y = [2, 4, 1, 5, 3]

plt.figure(figsize=(10, 6))
plt.bar(x, y)
plt.xticks(x, ['Category A', 'Category B', 'Category C', 'Category D', 'Category E'], rotation=45)
plt.title('How to Rotate X-Axis Labels in Matplotlib - how2matplotlib.com')
plt.tight_layout()
plt.show()
Output:

在这个例子中,我们创建了一个简单的条形图,并使用plt.xticks()函数设置X轴的刻度标签。rotation=45参数将标签文本旋转45度。plt.tight_layout()函数用于自动调整子图参数,以给定的填充适合图形。
2. 使用set_xticklabels()方法
另一种旋转X轴刻度标签的方法是使用ax.set_xticklabels()方法。这种方法特别适用于使用面向对象的方式创建图表时。
import matplotlib.pyplot as plt
import numpy as np

x = np.arange(5)
y = [2, 4, 1, 5, 3]

fig, ax = plt.subplots(figsize=(10, 6))
ax.bar(x, y)
ax.set_xticks(x)
ax.set_xticklabels(['Category A', 'Category B', 'Category C', 'Category D', 'Category E'], rotation=45, ha='right')
ax.set_title('Rotating X-Axis Labels with set_xticklabels() - how2matplotlib.com')
plt.tight_layout()
plt.show()
Output:
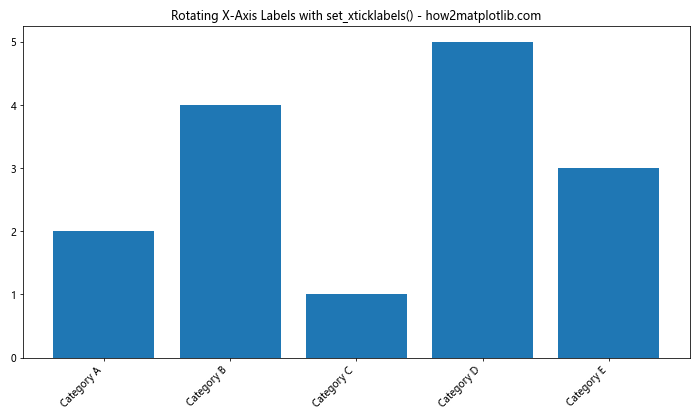
在这个例子中,我们首先使用ax.set_xticks()设置刻度的位置,然后使用ax.set_xticklabels()设置标签文本并旋转。ha='right'参数用于设置水平对齐方式,使旋转后的文本右对齐。
3. 调整标签对齐方式
当旋转标签时,有时需要调整标签的对齐方式,以确保它们不会重叠或超出图表边界。我们可以使用ha(水平对齐)和va(垂直对齐)参数来实现这一点。
import matplotlib.pyplot as plt
import numpy as np

x = np.arange(10)
y = np.random.rand(10)

fig, ax = plt.subplots(figsize=(12, 6))
ax.plot(x, y, marker='o')
ax.set_xticks(x)
ax.set_xticklabels([f'Long Label {i} - how2matplotlib.com' for i in x], rotation=45, ha='right', va='top')
ax.set_title('Adjusting Label Alignment - how2matplotlib.com')
plt.tight_layout()
plt.show()
Output:
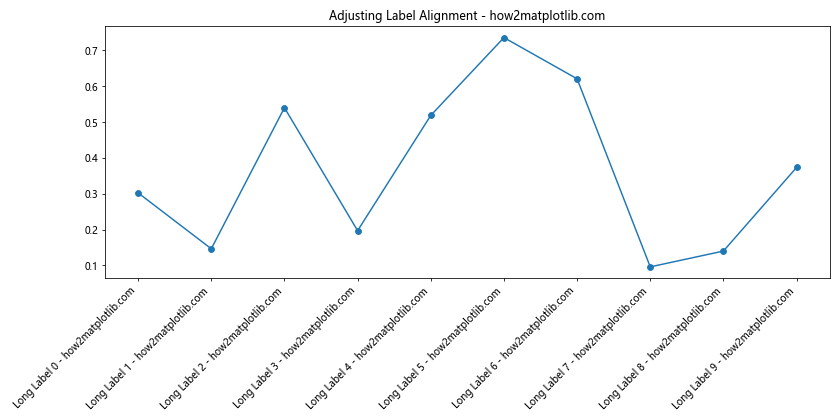
在这个例子中,我们使用了较长的标签文本,并将它们旋转45度。通过设置ha='right'和va='top',我们确保标签右对齐并向上对齐,这样可以避免标签重叠或超出图表底部。
4. 使用tick_params()方法
tick_params()方法提供了另一种旋转X轴刻度标签的方式,它允许我们一次性设置多个刻度参数。
import matplotlib.pyplot as plt
import numpy as np

x = np.arange(5)
y = [2, 4, 1, 5, 3]

fig, ax = plt.subplots(figsize=(10, 6))
ax.bar(x, y)
ax.set_xticks(x)
ax.set_xticklabels(['Category A', 'Category B', 'Category C', 'Category D', 'Category E'])
ax.tick_params(axis='x', rotation=45)
ax.set_title('Rotating Labels with tick_params() - how2matplotlib.com')
plt.tight_layout()
plt.show()
Output:
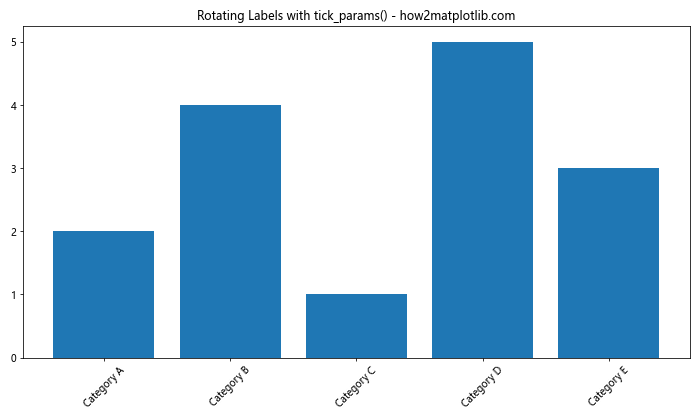
在这个例子中,我们使用ax.tick_params(axis='x', rotation=45)来旋转X轴的刻度标签。这种方法的优点是可以同时设置其他刻度参数,如颜色、大小等。
5. 处理日期标签
当X轴表示日期时,旋转标签可以帮助更好地显示时间信息。以下是一个处理日期标签的例子:
import matplotlib.pyplot as plt
import pandas as pd

dates = pd.date_range(start='2023-01-01', end='2023-12-31', freq='M')
values = [100, 120, 90, 110, 95, 105, 115, 125, 130, 120, 110, 100]

fig, ax = plt.subplots(figsize=(12, 6))
ax.plot(dates, values, marker='o')
ax.set_xticks(dates)
ax.set_xticklabels([date.strftime('%Y-%m-%d') for date in dates], rotation=45, ha='right')
ax.set_title('Rotating Date Labels - how2matplotlib.com')
plt.tight_layout()
plt.show()
Output:
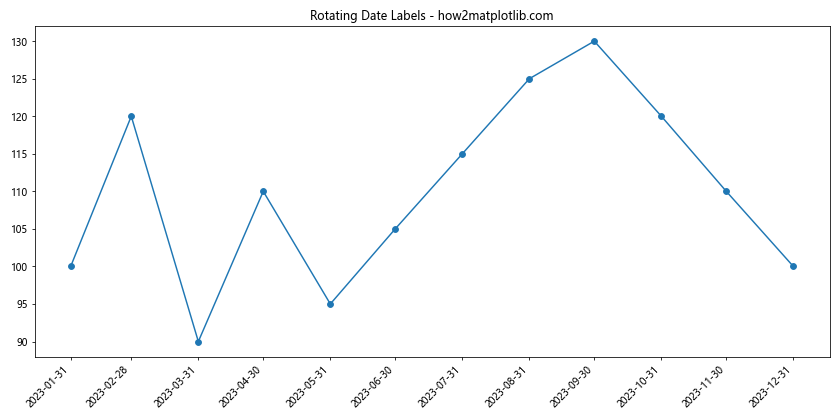
在这个例子中,我们使用pandas创建了一个日期范围,并绘制了相应的数据。通过旋转日期标签,我们可以清晰地显示每个数据点的具体日期。
6. 自动调整标签角度
有时,我们可能需要根据标签的长度自动调整旋转角度。以下是一个简单的实现:
import matplotlib.pyplot as plt
import numpy as np

def auto_rotate_labels(ax, labels):
    max_length = max(len(label) for label in labels)
    if max_length > 8:
        rotation = 45
    elif max_length > 5:
        rotation = 30
    else:
        rotation = 0
    ax.set_xticklabels(labels, rotation=rotation, ha='right' if rotation else 'center')

x = np.arange(5)
y = [2, 4, 1, 5, 3]
labels = ['Short', 'Medium Label', 'Very Long Label - how2matplotlib.com', 'Long Label', 'Normal']

fig, ax = plt.subplots(figsize=(10, 6))
ax.bar(x, y)
ax.set_xticks(x)
auto_rotate_labels(ax, labels)
ax.set_title('Auto-rotating Labels - how2matplotlib.com')
plt.tight_layout()
plt.show()
Output:
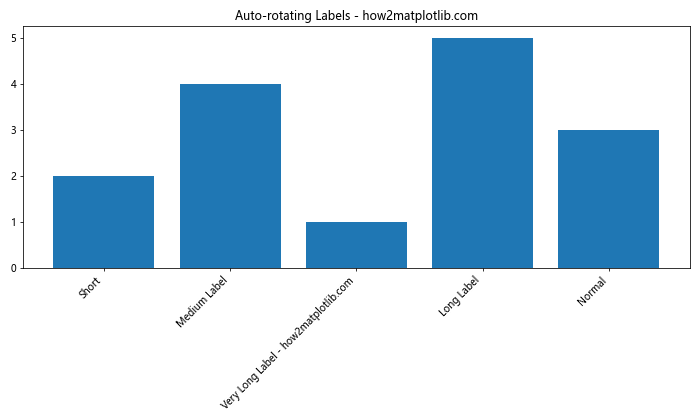
在这个例子中,我们定义了一个auto_rotate_labels函数,它根据标签的最大长度来决定旋转角度。这种方法可以在不同的场景下自动调整标签的显示方式。
7. 使用seaborn库
Seaborn是基于Matplotlib的统计数据可视化库,它提供了一些高级功能,可以更容易地处理标签旋转。
import seaborn as sns
import matplotlib.pyplot as plt
import pandas as pd

data = pd.DataFrame({
    'Category': ['A', 'B', 'C', 'D', 'E'],
    'Value': [2, 4, 1, 5, 3]
})

plt.figure(figsize=(10, 6))
sns.barplot(x='Category', y='Value', data=data)
plt.xticks(rotation=45, ha='right')
plt.title('Rotating Labels with Seaborn - how2matplotlib.com')
plt.tight_layout()
plt.show()
Output:
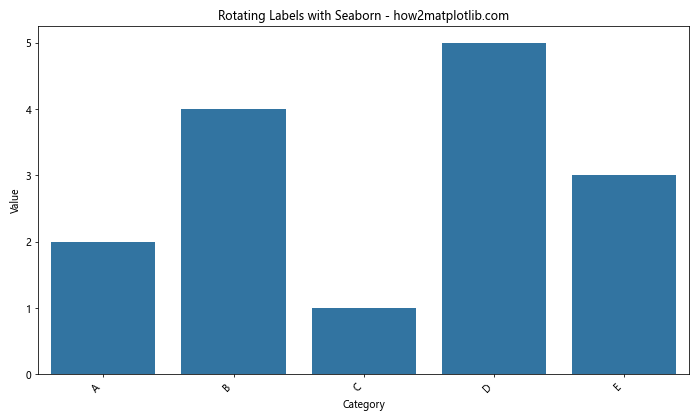
在这个例子中,我们使用Seaborn的barplot函数创建条形图,然后使用plt.xticks()旋转标签。Seaborn的优点是它可以直接处理pandas DataFrame,使数据处理和可视化更加方便。
8. 处理多子图
当我们有多个子图时,可能需要为每个子图单独设置标签旋转。以下是一个处理多子图的例子:
import matplotlib.pyplot as plt
import numpy as np

x = np.arange(5)
y1 = [2, 4, 1, 5, 3]
y2 = [1, 3, 2, 4, 5]

fig, (ax1, ax2) = plt.subplots(2, 1, figsize=(10, 10))

ax1.bar(x, y1)
ax1.set_xticks(x)
ax1.set_xticklabels(['A', 'B', 'C', 'D', 'E'], rotation=30)
ax1.set_title('Subplot 1 - how2matplotlib.com')

ax2.bar(x, y2)
ax2.set_xticks(x)
ax2.set_xticklabels(['Category 1', 'Category 2', 'Category 3', 'Category 4', 'Category 5'], rotation=45)
ax2.set_title('Subplot 2 - how2matplotlib.com')

plt.tight_layout()
plt.show()
Output:
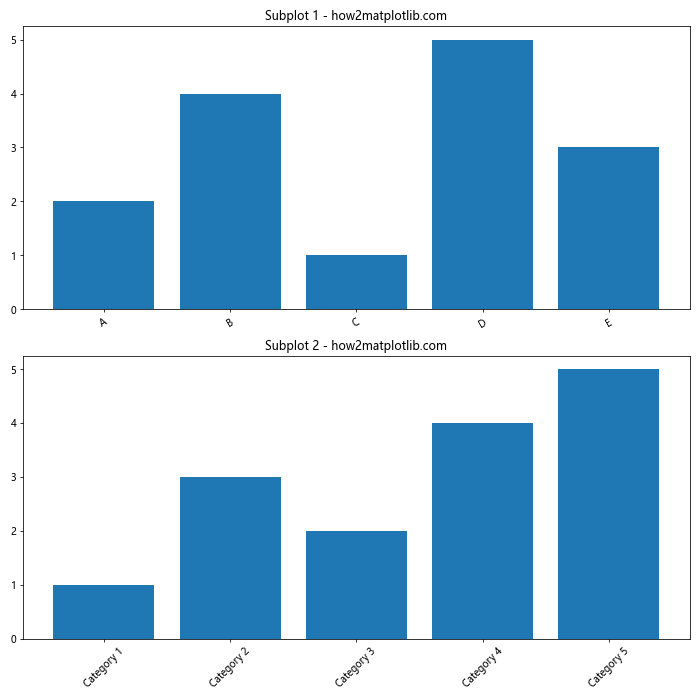
在这个例子中,我们创建了两个子图,并为每个子图单独设置了X轴标签和旋转角度。这种方法允许我们为不同的子图使用不同的标签和旋转设置。
9. 使用LaTeX格式的标签
Matplotlib支持LaTeX格式的文本,这对于显示数学公式或特殊符号非常有用。以下是一个使用LaTeX格式标签并旋转的例子:
import matplotlib.pyplot as plt
import numpy as np

plt.rcParams['text.usetex'] = True
plt.rcParams['font.family'] = 'serif'

x = np.arange(5)
y = [2, 4, 1, 5, 3]

fig, ax = plt.subplots(figsize=(10, 6))
ax.bar(x, y)
ax.set_xticks(x)
ax.set_xticklabels([r'\alpha', r'\beta', r'\gamma', r'\delta', r'\epsilon'], rotation=45)
ax.set_title(r'Rotating LaTeX Labels - \mathcal{H}ow2matplotlib.com')
plt.tight_layout()
plt.show()
在这个例子中,我们首先设置Matplotlib使用LaTeX渲染文本。然后,我们使用LaTeX格式的希腊字母作为X轴标签,并将它们旋转45度。注意,LaTeX格式的文本需要用原始字符串(r”)表示。
10. 动态调整图表大小
当标签旋转后,有时可能需要调整图表的大小以适应旋转后的标签。以下是一个动态调整图表大小的例子:
import matplotlib.pyplot as plt
import numpy as np

def adjust_figure_size(fig, ax):
    bbox = ax.get_window_extent().transformed(fig.dpi_scale_trans.inverted())
    width, height = bbox.width, bbox.height
    fig.set_size_inches(width * 1.2, height * 1.2)

x = np.arange(10)
y = np.random.rand(10)

fig, ax = plt.subplots()
ax.bar(x, y)
ax.set_xticks(x)
ax.set_xticklabels([f'Long Label {i} - how2matplotlib.com' for i in x], rotation=45, ha='right')
ax.set_title('Dynamically Adjusting Figure Size')

adjust_figure_size(fig, ax)
plt.tight_layout()
plt.show()
Output:
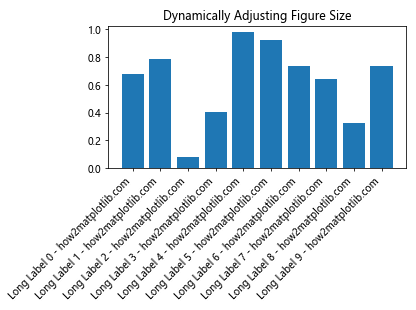
在这个例子中,我们定义了一个adjust_figure_size函数,它根据轴的当前大小来调整图形的大小。这样可以确保旋转后的标签不会被截断或重叠。
11. 使用颜色编码的标签
有时,我们可能想要使用不同的颜色来强调某些标签。以下是一个使用颜色编码标签并旋转的例子:
import matplotlib.pyplot as plt
import numpy as np

x = np.arange(5)
y = [2, 4, 1, 5, 3]
labels = ['Category A', 'Category B', 'Category C', 'Category D', 'Category E']
colors = ['red', 'green', 'blue', 'orange', 'purple']

fig, ax = plt.subplots(figsize=(10, 6))
ax.bar(x, y)
ax.set_xticks(x)

for i, (label, color) in enumerate(zip(labels, colors)):
    ax.text(i, -0.1, label, rotation=45, ha='right', va='top', color=color, transform=ax.get_xaxis_transform())

ax.set_title('Color-coded Rotated Labels - how2matplotlib.com')
ax.tick_params(axis='x', which='both', bottom=False, top=False, labelbottom=False)
plt.tight_layout()
plt.show()
Output:
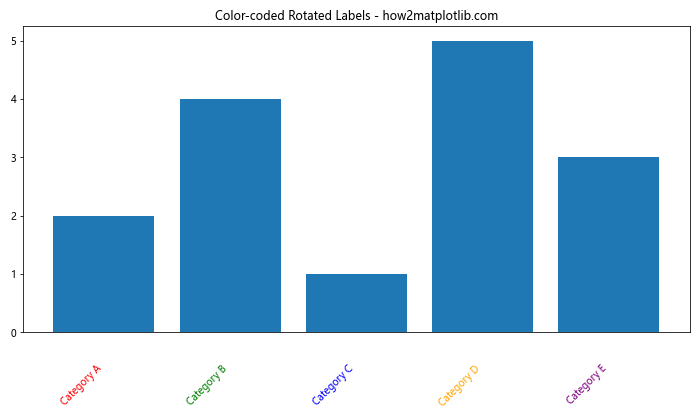
在这个例子中,我们使用ax.text()函数为每个标签单独设置颜色和位置。通过设置transform=ax.get_xaxis_transform(),我们确保标签位置相对于X轴。
12. 处理长标签和文本换行
当标签文本非常长时,即使旋转也可能无法完全显示。在这种情况下,我们可以考虑使用文本换行来显示长标签。以下是一个处理长标签和文本换行的例子:
import matplotlib.pyplot as plt
import numpy as np
import textwrap

def wrap_labels(labels, max_width=10):
    return ['\n'.join(textwrap.wrap(label, max_width)) for label in labels]

x = np.arange(5)
y = [2, 4, 1, 5, 3]
labels = ['Short', 'Medium Length', 'Very Long Label Text - how2matplotlib.com', 'Another Long Label', 'Normal']

fig, ax = plt.subplots(figsize=(12, 6))
ax.bar(x, y)
ax.set_xticks(x)
ax.set_xticklabels(wrap_labels(labels), rotation=45, ha='right')
ax.set_title('Handling Long Labels with Text Wrapping - how2matplotlib.com')
plt.tight_layout()
plt.show()
Output:
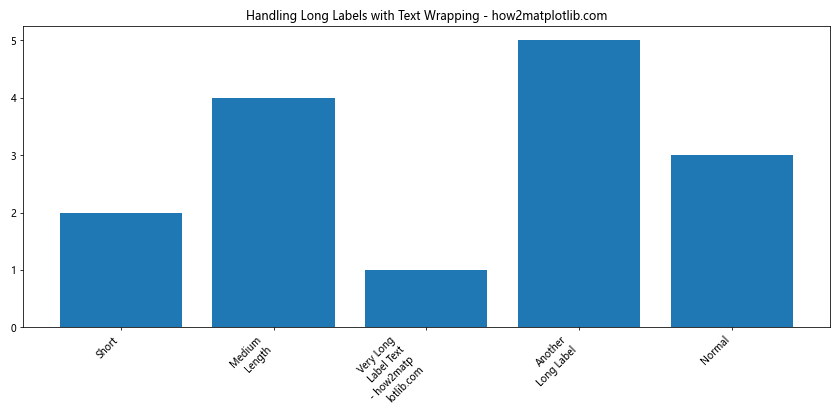
在这个例子中,我们定义了一个wrap_labels函数,它使用textwrap模块将长标签文本换行。这样可以在不过度旋转的情况下显示完整的标签文本。
13. 使用垂直标签
在某些情况下,将标签完全垂直显示可能是一个好选择,特别是当标签文本较长且数量较多时。以下是一个使用垂直标签的例子:
import matplotlib.pyplot as plt
import numpy as np

x = np.arange(10)
y = np.random.rand(10)
labels = [f'Category {i} - how2matplotlib.com' for i in range(1, 11)]

fig, ax = plt.subplots(figsize=(12, 6))
ax.bar(x, y)
ax.set_xticks(x)
ax.set_xticklabels(labels, rotation=90, ha='center', va='top')
ax.set_title('Using Vertical Labels - how2matplotlib.com')
plt.tight_layout()
plt.show()
Output:
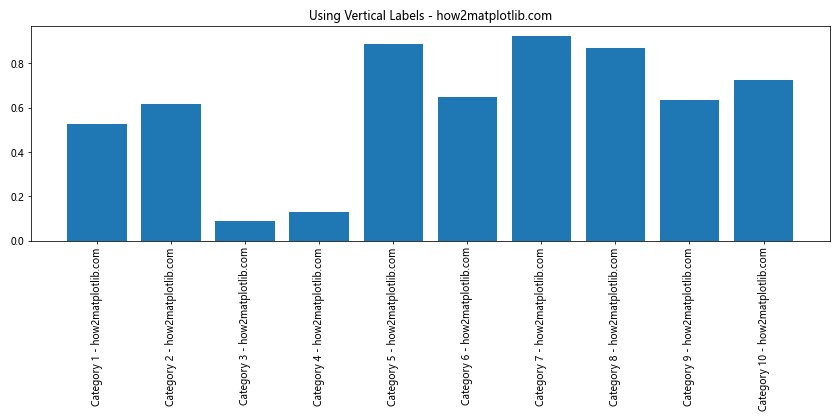
在这个例子中,我们将标签旋转90度,使其完全垂直显示。通过设置ha='center'和va='top',我们确保标签居中对齐并位于刻度线的顶部。
14. 交错标签
当有大量标签需要显示时,另一种有效的方法是使用交错标签。这种方法可以在不旋转标签的情况下显示更多信息。以下是一个实现交错标签的例子:
import matplotlib.pyplot as plt
import numpy as np

x = np.arange(20)
y = np.random.rand(20)
labels = [f'Label {i} - how2matplotlib.com' for i in range(1, 21)]

fig, ax = plt.subplots(figsize=(15, 6))
ax.bar(x, y)
ax.set_xticks(x)
ax.set_xticklabels(labels)

for i, label in enumerate(ax.get_xticklabels()):
    if i % 2 == 0:
        label.set_y(label.get_position()[1] - 0.05)
    else:
        label.set_y(label.get_position()[1] - 0.1)

ax.set_title('Staggered Labels - how2matplotlib.com')
plt.tight_layout()
plt.show()
Output:
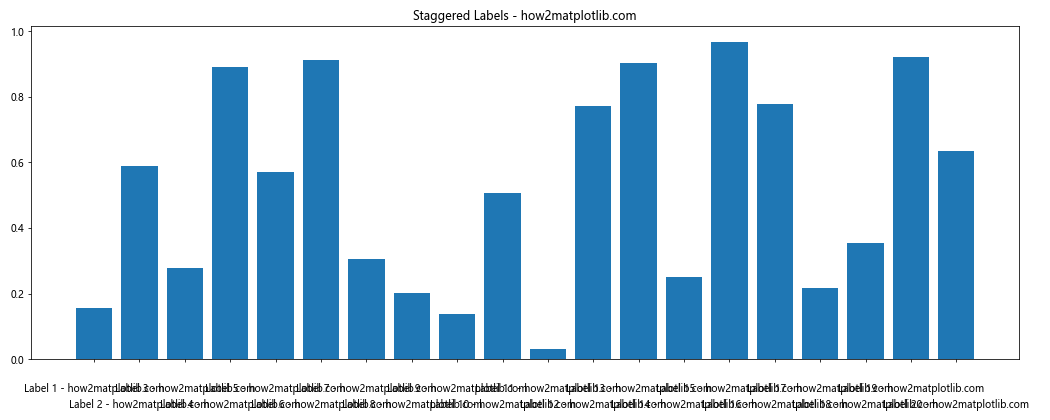
在这个例子中,我们通过调整每个标签的y位置来创建交错效果。偶数索引的标签位置略高,奇数索引的标签位置略低,这样可以避免标签重叠。
15. 使用自定义刻度定位器
Matplotlib提供了多种刻度定位器,可以帮助我们更好地控制刻度的位置和数量。这在处理大量数据或特殊数据分布时特别有用。以下是一个使用自定义刻度定位器的例子:
import matplotlib.pyplot as plt
import numpy as np
from matplotlib.ticker import MaxNLocator

x = np.linspace(0, 100, 1000)
y = np.sin(x)

fig, ax = plt.subplots(figsize=(12, 6))
ax.plot(x, y)

ax.xaxis.set_major_locator(MaxNLocator(nbins=10))
ax.set_xticklabels([f'{tick:.1f}\nHow2matplotlib' for tick in ax.get_xticks()], rotation=45, ha='right')

ax.set_title('Using Custom Tick Locator - how2matplotlib.com')
plt.tight_layout()
plt.show()
Output:
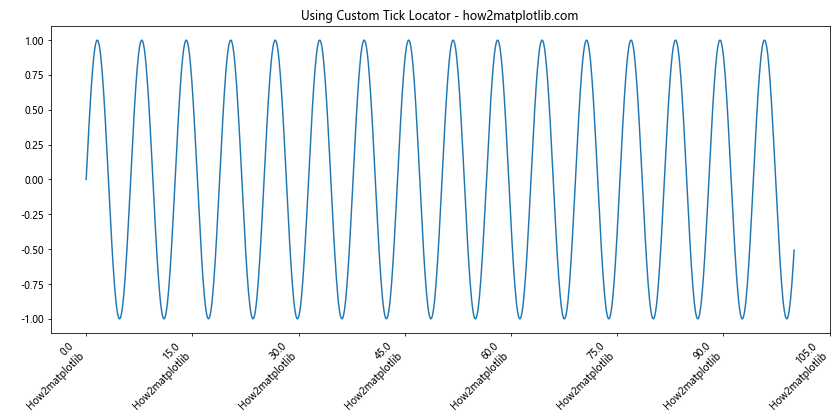
在这个例子中,我们使用MaxNLocator来限制X轴上的刻度数量。然后,我们为每个刻度设置自定义标签,包括换行和网站名称。
16. 处理极坐标图
在极坐标图中,标签的旋转需要特别处理。以下是一个在极坐标图中旋转标签的例子:
import matplotlib.pyplot as plt
import numpy as np

theta = np.linspace(0, 2*np.pi, 8, endpoint=False)
r = np.random.rand(8)
labels = ['N', 'NE', 'E', 'SE', 'S', 'SW', 'W', 'NW']

fig, ax = plt.subplots(figsize=(8, 8), subplot_kw=dict(projection='polar'))
ax.bar(theta, r, width=0.5)
ax.set_xticks(theta)
ax.set_xticklabels(labels)

for label, angle in zip(ax.get_xticklabels(), theta):
    if angle in (0, np.pi):
        label.set_horizontalalignment('center')
    elif 0 < angle < np.pi:
        label.set_horizontalalignment('left')
    else:
        label.set_horizontalalignment('right')

ax.set_title('Rotating Labels in Polar Plot - how2matplotlib.com')
plt.tight_layout()
plt.show()
Output:
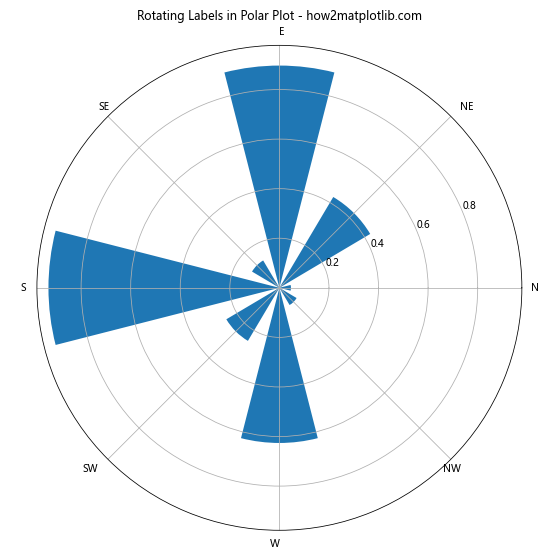
在这个例子中,我们创建了一个极坐标图,并根据标签的位置调整其对齐方式。这确保了标签始终朝向图的外侧,提高了可读性。
17. 动态更新标签
在某些应用中,我们可能需要动态更新图表的标签。以下是一个演示如何动态更新和旋转标签的例子:
import matplotlib.pyplot as plt
import numpy as np
from matplotlib.animation import FuncAnimation

fig, ax = plt.subplots(figsize=(10, 6))
x = np.arange(5)
y = np.random.rand(5)
bars = ax.bar(x, y)

def update(frame):
    new_y = np.random.rand(5)
    for bar, h in zip(bars, new_y):
        bar.set_height(h)
    ax.set_ylim(0, 1)
    labels = [f'Frame {frame}\nValue {val:.2f}\nHow2matplotlib' for val in new_y]
    ax.set_xticks(x)
    ax.set_xticklabels(labels, rotation=45, ha='right')
    ax.set_title(f'Dynamic Label Update - Frame {frame} - how2matplotlib.com')

ani = FuncAnimation(fig, update, frames=range(100), repeat=False, interval=500)
plt.tight_layout()
plt.show()
Output:
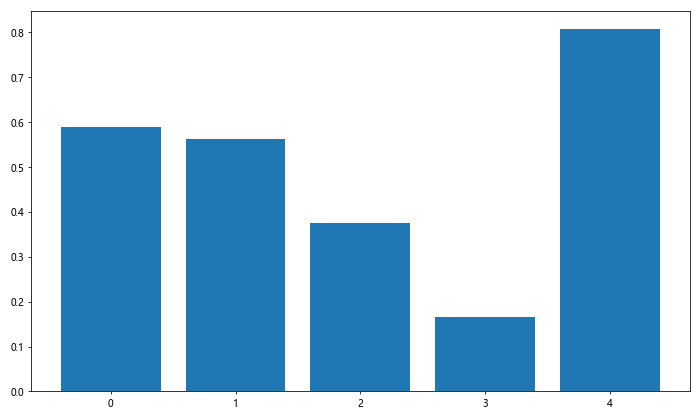
在这个例子中,我们创建了一个动画,每帧都更新条形图的高度和X轴标签。标签包含当前帧号和条形高度,并在每次更新时重新旋转。
18. 使用不同字体和样式
有时,我们可能想要为旋转的标签使用不同的字体或样式,以增强可读性或美观性。以下是一个使用不同字体和样式的例子:
import matplotlib.pyplot as plt
import numpy as np
from matplotlib import font_manager

x = np.arange(5)
y = [2, 4, 1, 5, 3]
labels = ['Bold', 'Italic', 'Normal', 'Large', 'Small']

fig, ax = plt.subplots(figsize=(10, 6))
ax.bar(x, y)
ax.set_xticks(x)

for i, label in enumerate(labels):
    if i == 0:
        ax.text(i, -0.1, f'{label}\nHow2matplotlib', rotation=45, ha='right', va='top',
                fontweight='bold', transform=ax.get_xaxis_transform())
    elif i == 1:
        ax.text(i, -0.1, f'{label}\nHow2matplotlib', rotation=45, ha='right', va='top',
                fontstyle='italic', transform=ax.get_xaxis_transform())
    elif i == 3:
        ax.text(i, -0.1, f'{label}\nHow2matplotlib', rotation=45, ha='right', va='top',
                fontsize=14, transform=ax.get_xaxis_transform())
    elif i == 4:
        ax.text(i, -0.1, f'{label}\nHow2matplotlib', rotation=45, ha='right', va='top',
                fontsize=8, transform=ax.get_xaxis_transform())
    else:
        ax.text(i, -0.1, f'{label}\nHow2matplotlib', rotation=45, ha='right', va='top',
                transform=ax.get_xaxis_transform())

ax.set_title('Different Font Styles for Rotated Labels - how2matplotlib.com')
ax.tick_params(axis='x', which='both', bottom=False, top=False, labelbottom=False)
plt.tight_layout()
plt.show()
Output:
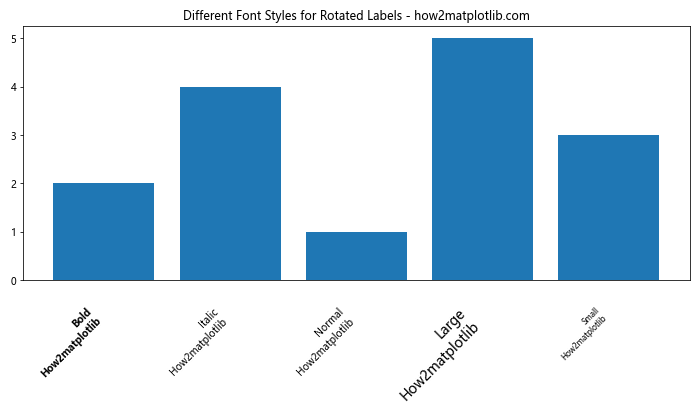
在这个例子中,我们为每个标签使用了不同的字体样式,包括粗体、斜体、大号和小号字体。这种方法可以用来强调某些特定的标签或创建视觉层次。
19. 处理重叠标签
当有大量标签时,即使旋转也可能出现重叠。一种解决方案是只显示部分标签。以下是一个处理重叠标签的例子:
import matplotlib.pyplot as plt
import numpy as np

x = np.arange(50)
y = np.random.rand(50)

fig, ax = plt.subplots(figsize=(15, 6))
ax.plot(x, y)

# 只显示每5个标签
ax.set_xticks(x[::5])
ax.set_xticklabels([f'Label {i}\nHow2matplotlib' for i in x[::5]], rotation=45, ha='right')

ax.set_title('Handling Overlapping Labels - how2matplotlib.com')
plt.tight_layout()
plt.show()
Output:
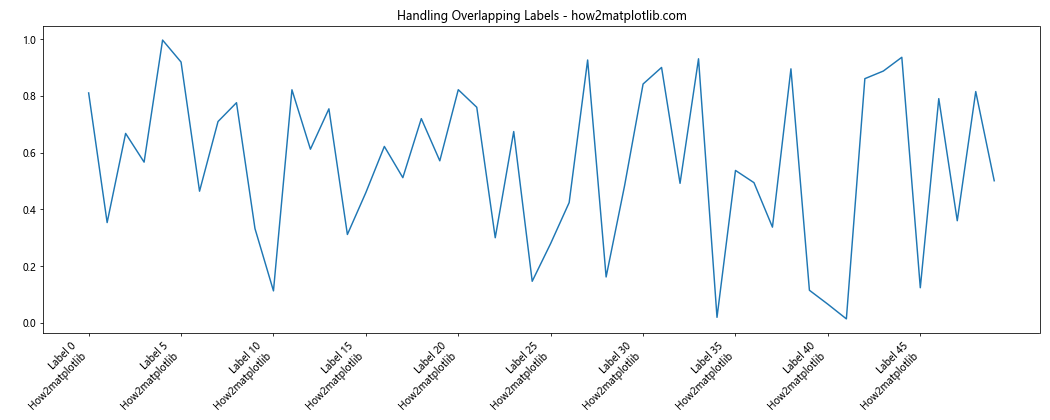
在这个例子中,我们只显示了每5个标签,这样可以有效减少标签重叠的问题。对于中间的数据点,用户可以通过插值来估计它们的值。
20. 使用双轴标签
在某些情况下,我们可能需要在X轴上显示两组不同的标签。以下是一个使用双轴标签的例子:
import matplotlib.pyplot as plt
import numpy as np

x = np.arange(5)
y = [2, 4, 1, 5, 3]
labels1 = ['A', 'B', 'C', 'D', 'E']
labels2 = ['Category 1', 'Category 2', 'Category 3', 'Category 4', 'Category 5']

fig, ax1 = plt.subplots(figsize=(12, 6))
ax1.bar(x, y)
ax1.set_xticks(x)
ax1.set_xticklabels(labels1, rotation=45, ha='right')

ax2 = ax1.twiny()
ax2.set_xticks(x)
ax2.set_xticklabels(labels2, rotation=45, ha='left')
ax2.set_xlim(ax1.get_xlim())

ax1.set_title('Dual Axis Labels - how2matplotlib.com')
plt.tight_layout()
plt.show()
Output:
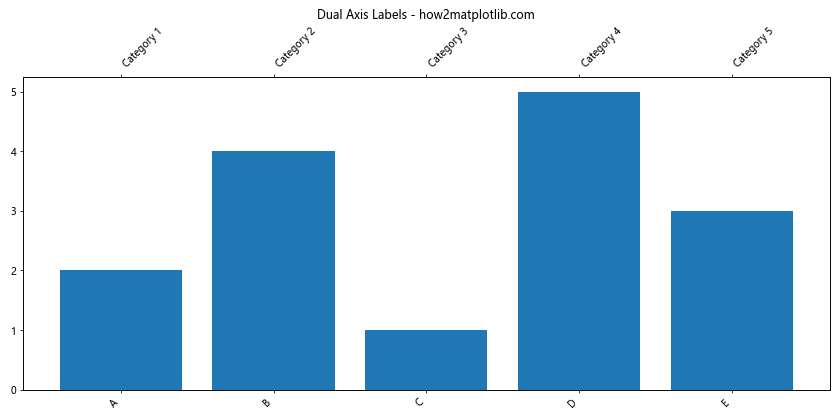
在这个例子中,我们创建了两个X轴,每个轴显示不同的标签集。这种方法可以用来显示多层次的分类信息或不同尺度的数据。
总结起来,Matplotlib提供了多种方法来旋转和调整X轴刻度标签。通过合理使用这些技术,我们可以大大提高图表的可读性和美观性。无论是处理长文本、日期标签,还是特殊的图表类型,都有相应的解决方案。在实际应用中,我们需要根据具体的数据特点和展示需求,选择最合适的方法来旋转和调整标签。同时,也要注意整体布局和美观性,确保图表清晰易读,有效传达信息。
 极客教程
极客教程