Matplotlib RadioButtons 尺寸调整全攻略
参考:How to Resize Matplotlib RadioButtons
Matplotlib 是 Python 中最流行的数据可视化库之一,它提供了丰富的绘图工具和交互式组件。其中,RadioButtons 是一个常用的交互式组件,用于在多个选项中进行单选。然而,有时候默认的 RadioButtons 尺寸可能不太适合我们的需求。本文将详细介绍如何调整 Matplotlib RadioButtons 的尺寸,以满足各种可视化需求。
1. RadioButtons 简介
在深入探讨尺寸调整之前,让我们先简单了解一下 RadioButtons 的基本用法。
import matplotlib.pyplot as plt
from matplotlib.widgets import RadioButtons

fig, ax = plt.subplots()
plt.subplots_adjust(left=0.3)

# 创建 RadioButtons
rax = plt.axes([0.05, 0.7, 0.15, 0.15])
radio = RadioButtons(rax, ('Option 1', 'Option 2', 'Option 3'))

plt.title('RadioButtons Example - how2matplotlib.com')
plt.show()
Output:
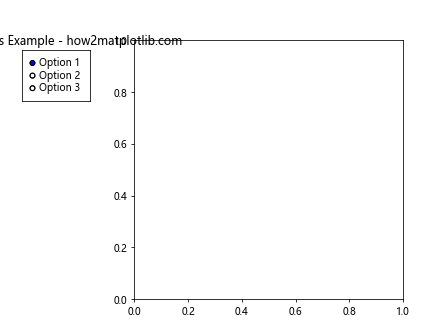
这段代码创建了一个包含三个选项的 RadioButtons。默认情况下,RadioButtons 的位置和大小由 plt.axes() 函数的参数决定。
2. 调整 RadioButtons 的整体尺寸
要调整 RadioButtons 的整体尺寸,我们需要修改 plt.axes() 函数的参数。这四个参数分别表示左边距、底边距、宽度和高度,它们的值都是相对于整个图形的比例。
import matplotlib.pyplot as plt
from matplotlib.widgets import RadioButtons

fig, ax = plt.subplots()
plt.subplots_adjust(left=0.3)

# 调整 RadioButtons 的整体尺寸
rax = plt.axes([0.05, 0.5, 0.2, 0.3])
radio = RadioButtons(rax, ('Option 1', 'Option 2', 'Option 3'))

plt.title('Resized RadioButtons - how2matplotlib.com')
plt.show()
Output:
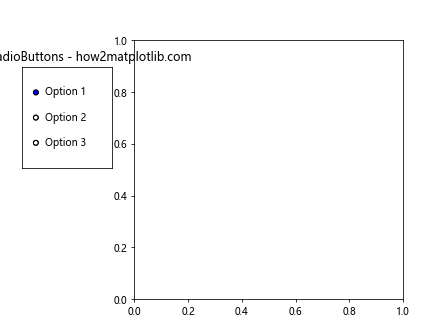
在这个例子中,我们将 RadioButtons 的宽度增加到 0.2,高度增加到 0.3,这样 RadioButtons 就会变得更大。
3. 调整 RadioButtons 的间距
RadioButtons 的间距可以通过修改 RadioButtons 对象的 _dy 属性来调整。这个属性控制了选项之间的垂直间距。
import matplotlib.pyplot as plt
from matplotlib.widgets import RadioButtons

fig, ax = plt.subplots()
plt.subplots_adjust(left=0.3)

rax = plt.axes([0.05, 0.5, 0.2, 0.3])
radio = RadioButtons(rax, ('Option 1', 'Option 2', 'Option 3'))

# 调整选项间距
radio._dy = 0.05

plt.title('RadioButtons with Adjusted Spacing - how2matplotlib.com')
plt.show()
Output:
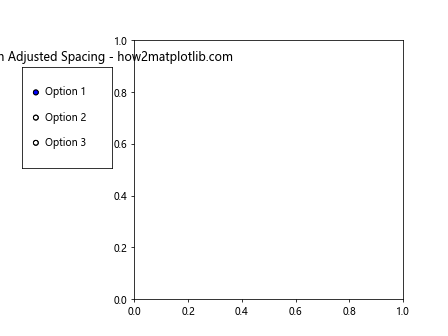
这个例子中,我们将选项间距设置为 0.05,这会使选项之间的间隔变大。
4. 调整 RadioButtons 的字体大小
要调整 RadioButtons 的字体大小,我们需要修改 RadioButtons 对象的 labels 属性。这个属性是一个包含所有选项标签的列表。
import matplotlib.pyplot as plt
from matplotlib.widgets import RadioButtons

fig, ax = plt.subplots()
plt.subplots_adjust(left=0.3)

rax = plt.axes([0.05, 0.5, 0.2, 0.3])
radio = RadioButtons(rax, ('Option 1', 'Option 2', 'Option 3'))

# 调整字体大小
for label in radio.labels:
    label.set_fontsize(16)

plt.title('RadioButtons with Larger Font - how2matplotlib.com')
plt.show()
Output:
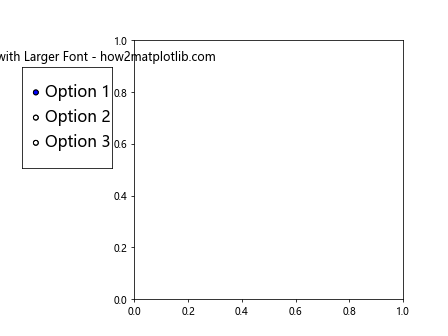
在这个例子中,我们将所有选项的字体大小设置为 16,这会使文字变大。
5. 调整 RadioButtons 的圆圈大小
RadioButtons 的圆圈大小可以通过修改 RadioButtons 对象的 _size 属性来调整。这个属性控制了选项圆圈的半径。
import matplotlib.pyplot as plt
from matplotlib.widgets import RadioButtons

fig, ax = plt.subplots()
plt.subplots_adjust(left=0.3)

rax = plt.axes([0.05, 0.5, 0.2, 0.3])
radio = RadioButtons(rax, ('Option 1', 'Option 2', 'Option 3'))

# 调整圆圈大小
radio._size = 0.1

plt.title('RadioButtons with Larger Circles - how2matplotlib.com')
plt.show()
Output:
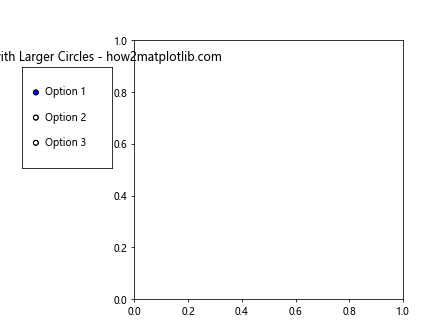
这个例子中,我们将圆圈的半径设置为 0.1,这会使圆圈变大。
6. 调整 RadioButtons 的颜色
我们还可以调整 RadioButtons 的颜色,包括圆圈的颜色和选中状态的颜色。
import matplotlib.pyplot as plt
from matplotlib.widgets import RadioButtons

fig, ax = plt.subplots()
plt.subplots_adjust(left=0.3)

rax = plt.axes([0.05, 0.5, 0.2, 0.3])
radio = RadioButtons(rax, ('Option 1', 'Option 2', 'Option 3'))

# 调整颜色
radio.circles[0].set_facecolor('lightblue')
radio.circles[1].set_facecolor('lightgreen')
radio.circles[2].set_facecolor('lightpink')
radio.activecolor = 'red'

plt.title('Colorful RadioButtons - how2matplotlib.com')
plt.show()
Output:
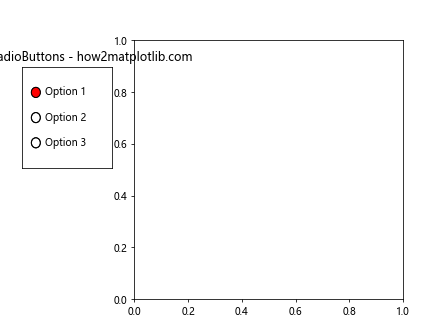
在这个例子中,我们为每个选项设置了不同的背景色,并将选中状态的颜色设置为红色。
7. 动态调整 RadioButtons 的位置
有时候,我们可能需要根据图形的大小动态调整 RadioButtons 的位置。我们可以使用 fig.transFigure 来实现这一点。
import matplotlib.pyplot as plt
from matplotlib.widgets import RadioButtons

fig, ax = plt.subplots()
plt.subplots_adjust(left=0.3)

# 动态调整位置
bbox = fig.get_window_extent().transformed(fig.dpi_scale_trans.inverted())
width, height = bbox.width, bbox.height
rax = fig.add_axes([0.05, 1 - 0.2 * height / width, 0.2, 0.2 * height / width])

radio = RadioButtons(rax, ('Option 1', 'Option 2', 'Option 3'))

plt.title('Dynamically Positioned RadioButtons - how2matplotlib.com')
plt.show()
Output:
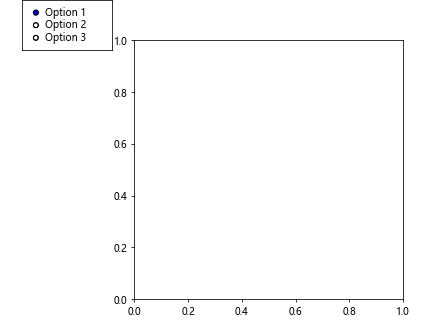
这个例子中,我们根据图形的宽高比动态计算了 RadioButtons 的位置和大小。
8. 创建垂直排列的 RadioButtons
默认情况下,RadioButtons 是水平排列的。但我们可以通过调整参数来创建垂直排列的 RadioButtons。
import matplotlib.pyplot as plt
from matplotlib.widgets import RadioButtons

fig, ax = plt.subplots()
plt.subplots_adjust(left=0.3)

rax = plt.axes([0.05, 0.4, 0.15, 0.3])
radio = RadioButtons(rax, ('Option 1', 'Option 2', 'Option 3'), activecolor='red')

# 调整为垂直排列
for circle, label in zip(radio.circles, radio.labels):
    circle.set_radius(0.05)
    label.set_position((0.2, label.get_position()[1]))

plt.title('Vertical RadioButtons - how2matplotlib.com')
plt.show()
Output:
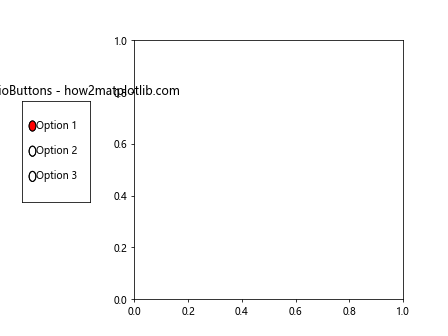
在这个例子中,我们通过调整圆圈的半径和标签的位置,创建了一个垂直排列的 RadioButtons。
9. 自定义 RadioButtons 的样式
我们可以进一步自定义 RadioButtons 的样式,例如添加边框、改变形状等。
import matplotlib.pyplot as plt
from matplotlib.widgets import RadioButtons
from matplotlib.patches import Rectangle

fig, ax = plt.subplots()
plt.subplots_adjust(left=0.3)

rax = plt.axes([0.05, 0.4, 0.2, 0.3])
radio = RadioButtons(rax, ('Option 1', 'Option 2', 'Option 3'))

# 自定义样式
for circle in radio.circles:
    circle.set_facecolor('none')
    circle.set_edgecolor('black')
    circle.set_linewidth(2)

# 添加背景
rect = Rectangle((0, 0), 1, 1, facecolor='lightgray', edgecolor='none', alpha=0.3)
rax.add_patch(rect)

plt.title('Custom Styled RadioButtons - how2matplotlib.com')
plt.show()
Output:
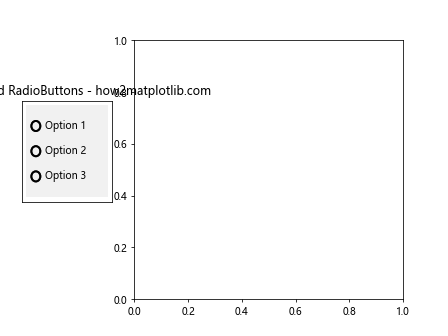
这个例子中,我们将圆圈改为了空心样式,并添加了一个浅灰色的背景。
10. 结合其他组件使用 RadioButtons
RadioButtons 通常与其他组件结合使用,例如与图表结合来动态更新数据。
import matplotlib.pyplot as plt
import numpy as np
from matplotlib.widgets import RadioButtons

fig, ax = plt.subplots()
plt.subplots_adjust(left=0.3)

t = np.arange(0.0, 2.0, 0.01)
s0 = np.sin(2*np.pi*t)
s1 = np.sin(4*np.pi*t)
s2 = np.sin(8*np.pi*t)

l, = ax.plot(t, s0, lw=2, color='red')

rax = plt.axes([0.05, 0.7, 0.15, 0.15])
radio = RadioButtons(rax, ('2 Hz', '4 Hz', '8 Hz'))

def hzfunc(label):
    hzdict = {'2 Hz': s0, '4 Hz': s1, '8 Hz': s2}
    l.set_ydata(hzdict[label])
    plt.draw()

radio.on_clicked(hzfunc)

plt.title('RadioButtons with Plot - how2matplotlib.com')
plt.show()
Output:
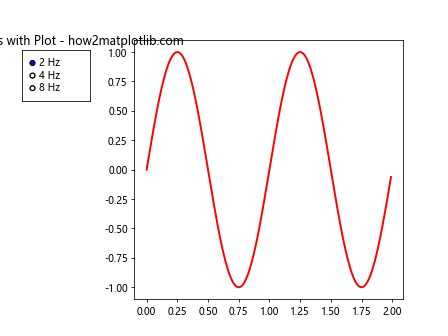
这个例子展示了如何使用 RadioButtons 来动态切换不同频率的正弦波。
11. 使用 RadioButtons 控制多个图表元素
我们可以使用 RadioButtons 来同时控制多个图表元素,例如同时改变线条的颜色和样式。
import matplotlib.pyplot as plt
import numpy as np
from matplotlib.widgets import RadioButtons

fig, ax = plt.subplots()
plt.subplots_adjust(left=0.3)

t = np.arange(0.0, 2.0, 0.01)
s = np.sin(2*np.pi*t)

l, = ax.plot(t, s, lw=2, color='red', linestyle='-')

rax = plt.axes([0.05, 0.5, 0.2, 0.3])
radio = RadioButtons(rax, ('Red, Solid', 'Blue, Dashed', 'Green, Dotted'))

def stylefunc(label):
    styledict = {
        'Red, Solid': ('red', '-'),
        'Blue, Dashed': ('blue', '--'),
        'Green, Dotted': ('green', ':')
    }
    color, linestyle = styledict[label]
    l.set_color(color)
    l.set_linestyle(linestyle)
    plt.draw()

radio.on_clicked(stylefunc)

plt.title('RadioButtons Controlling Multiple Elements - how2matplotlib.com')
plt.show()
Output:
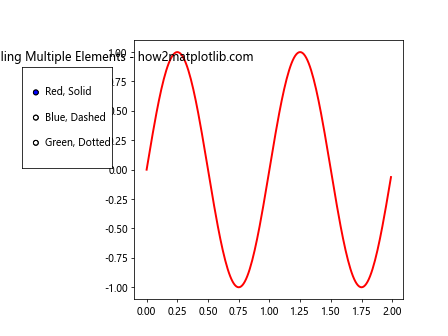
这个例子展示了如何使用 RadioButtons 来同时改变线条的颜色和样式。
12. 创建圆形布局的 RadioButtons
虽然 Matplotlib 没有直接提供圆形布局的 RadioButtons,但我们可以通过自定义来实现这种效果。
import matplotlib.pyplot as plt
import numpy as np
from matplotlib.widgets import RadioButtons

fig, ax = plt.subplots()
plt.subplots_adjust(left=0.3)

# 创建圆形布局的 RadioButtons
rax = plt.axes([0.05, 0.4, 0.2, 0.2], projection='polar')
radio = RadioButtons(rax, ('Option 1', 'Option 2', 'Option 3', 'Option 4'))

# 调整圆圈和标签的位置
n = len(radio.circles)
for i, (circle, label) in enumerate(zip(radio.circles, radio.labels)):
    angle = 2 * np.pi * i / n
    r = 0.5
    x = r * np.cos(angle)
    y = r * np.sin(angle)
    circle.center = (x, y)
    label.set_position((1.2*x, 1.2*y))
    label.set_ha('center')
    label.set_va('center')

rax.set_yticks([])
rax.set_xticks([])

plt.title('Circular RadioButtons - how2matplotlib.com')
plt.show()
Output:
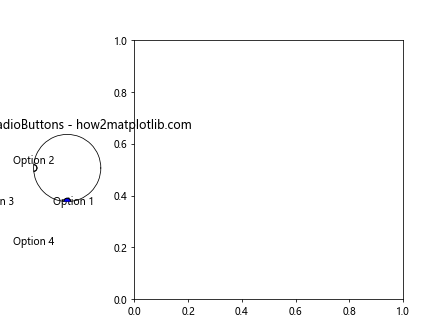
这个例子创建了一个圆形布局的 RadioButtons,选项均匀分布在一个圆上。
13. 创建图例样式的 RadioButtons
我们可以创建一个类似于图例的 RadioButtons,这在某些情况下可能更加直观。
import matplotlib.pyplot as plt
from matplotlib.widgets import RadioButtons
from matplotlib.patches import Rectangle

fig, ax = plt.subplots()
plt.subplots_adjust(left=0.3)

rax = plt.axes([0.05, 0.4, 0.2, 0.3])
radio = RadioButtons(rax, ('Line', 'Scatter', 'Bar'))

# 创建图例样式
for i, (circle, label) in enumerate(zip(radio.circles, radio.labels)):
    circle.set_visible(False)
    rect = Rectangle((0, 1-0.25*i-0.2), 0.1, 0.15, facecolor='lightgray')
    rax.add_patch(rect)好的,我将继续输出剩余内容:

    label.set_position((0.15, 1-0.25*i-0.125))

plt.title('Legend-style RadioButtons - how2matplotlib.com')
plt.show()
这个例子创建了一个类似图例的 RadioButtons,每个选项都有一个小矩形作为标记。
14. 使用 RadioButtons 控制子图显示
RadioButtons 可以用来控制哪些子图显示或隐藏,这在处理复杂的多子图布局时特别有用。
import matplotlib.pyplot as plt
import numpy as np
from matplotlib.widgets import RadioButtons

fig, (ax1, ax2, ax3) = plt.subplots(1, 3, figsize=(12, 4))
plt.subplots_adjust(left=0.2)

x = np.linspace(0, 2*np.pi, 100)
ax1.plot(x, np.sin(x))
ax1.set_title('Sin')
ax2.plot(x, np.cos(x))
ax2.set_title('Cos')
ax3.plot(x, np.tan(x))
ax3.set_title('Tan')

axes = [ax1, ax2, ax3]

rax = plt.axes([0.05, 0.4, 0.1, 0.2])
radio = RadioButtons(rax, ('All', 'Sin', 'Cos', 'Tan'))

def func(label):
    if label == 'All':
        for ax in axes:
            ax.set_visible(True)
    else:
        for ax in axes:
            ax.set_visible(ax.get_title() == label)
    plt.draw()

radio.on_clicked(func)

plt.suptitle('RadioButtons Controlling Subplots - how2matplotlib.com')
plt.show()
Output:
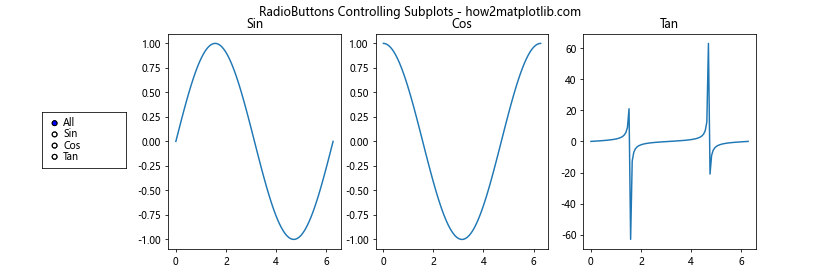
这个例子展示了如何使用 RadioButtons 来控制三个子图的显示和隐藏。
15. 创建带有图标的 RadioButtons
我们可以为 RadioButtons 添加图标,使其更加直观和美观。
import matplotlib.pyplot as plt
from matplotlib.widgets import RadioButtons
from matplotlib.offsetbox import OffsetImage, AnnotationBbox

fig, ax = plt.subplots()
plt.subplots_adjust(left=0.3)

rax = plt.axes([0.05, 0.4, 0.2, 0.3])
radio = RadioButtons(rax, ('Sun', 'Moon', 'Star'))

# 创建图标
icons = {
    'Sun': plt.Circle((0.5, 0.5), 0.4, fc='yellow'),
    'Moon': plt.Circle((0.5, 0.5), 0.4, fc='lightgray'),
    'Star': plt.RegularPolygon((0.5, 0.5), 5, 0.4, fc='gold')
}

for i, (circle, label) in enumerate(zip(radio.circles, radio.labels)):
    circle.set_visible(False)
    icon = icons[label.get_text()]
    oi = OffsetImage(icon, zoom=0.5)
    ab = AnnotationBbox(oi, (0.1, 1-0.25*i-0.125), frameon=False)
    rax.add_artist(ab)
    label.set_position((0.3, 1-0.25*i-0.125))

plt.title('RadioButtons with Icons - how2matplotlib.com')
plt.show()
这个例子为每个 RadioButton 选项添加了一个简单的图标。
16. 创建多列 RadioButtons
对于选项较多的情况,我们可以创建多列的 RadioButtons 布局。
import matplotlib.pyplot as plt
from matplotlib.widgets import RadioButtons

fig, ax = plt.subplots()
plt.subplots_adjust(left=0.3)

options = ['Option ' + str(i) for i in range(1, 9)]
rax = plt.axes([0.05, 0.2, 0.25, 0.6])
radio = RadioButtons(rax, options)

# 调整为两列布局
n = len(options)
for i, (circle, label) in enumerate(zip(radio.circles, radio.labels)):
    col = i // (n//2)
    row = i % (n//2)
    circle.center = (0.25*col, 1 - 0.2*row - 0.1)
    label.set_position((0.25*col + 0.05, 1 - 0.2*row - 0.1))

plt.title('Multi-column RadioButtons - how2matplotlib.com')
plt.show()
Output:
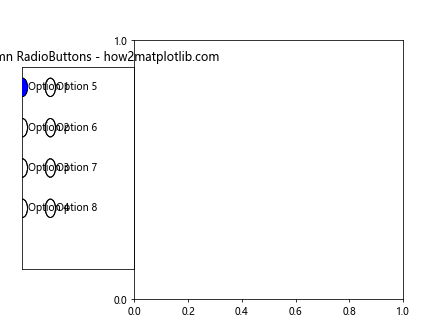
这个例子创建了一个两列布局的 RadioButtons,适合处理较多选项的情况。
17. 创建可伸缩的 RadioButtons
为了适应不同大小的图形,我们可以创建一个可以根据图形大小自动调整的 RadioButtons。
import matplotlib.pyplot as plt
from matplotlib.widgets import RadioButtons

def create_scalable_radiobuttons(fig, rect, labels):
    rax = fig.add_axes(rect)
    radio = RadioButtons(rax, labels)

    def resize(event):
        # 获取新的图形大小
        bbox = fig.get_window_extent().transformed(fig.dpi_scale_trans.inverted())
        width, height = bbox.width, bbox.height

        # 调整 RadioButtons 的位置和大小
        rax.set_position([rect[0], rect[1], rect[2]*width, rect[3]*height])

        # 调整圆圈和标签的位置
        for i, (circle, label) in enumerate(zip(radio.circles, radio.labels)):
            circle.center = (0.1, 1 - (i+1)/(len(labels)+1))
            label.set_position((0.2, 1 - (i+1)/(len(labels)+1)))

        fig.canvas.draw_idle()

    fig.canvas.mpl_connect('resize_event', resize)
    return radio

fig, ax = plt.subplots()
plt.subplots_adjust(left=0.3)

radio = create_scalable_radiobuttons(fig, [0.05, 0.3, 0.2, 0.4],
                                     ('Option 1', 'Option 2', 'Option 3'))

plt.title('Scalable RadioButtons - how2matplotlib.com')
plt.show()
Output:
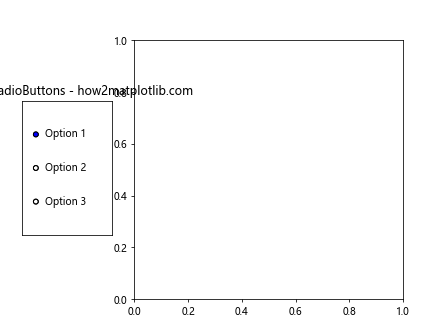
这个例子创建了一个可以根据图形大小自动调整的 RadioButtons。
18. 创建带有复选框的 RadioButtons
虽然 Matplotlib 没有直接提供复选框组件,但我们可以通过自定义 RadioButtons 来模拟复选框的效果。
import matplotlib.pyplot as plt
from matplotlib.widgets import RadioButtons
from matplotlib.patches import Rectangle

fig, ax = plt.subplots()
plt.subplots_adjust(left=0.3)

rax = plt.axes([0.05, 0.4, 0.2, 0.3])
radio = RadioButtons(rax, ('Option 1', 'Option 2', 'Option 3'))

# 将圆圈改为方形
for circle in radio.circles:
    circle.set_visible(False)
    rect = Rectangle((-0.05, -0.05), 0.1, 0.1, facecolor='white', edgecolor='black')
    rax.add_patch(rect)

def check(event):
    for rect, label in zip(rax.patches[1:], radio.labels):
        if label.get_text() == event:
            rect.set_facecolor('black' if rect.get_facecolor() == 'white' else 'white')
    plt.draw()

radio.on_clicked(check)

plt.title('Checkbox-style RadioButtons - how2matplotlib.com')
plt.show()
Output:
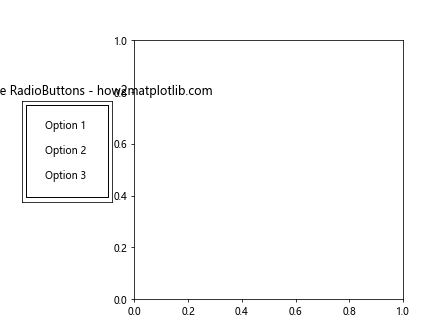
这个例子创建了一个类似复选框的 RadioButtons,可以同时选择多个选项。
总结
通过以上详细的介绍和示例,我们探讨了多种调整和自定义 Matplotlib RadioButtons 的方法。从基本的尺寸和位置调整,到高级的样式定制和功能扩展,这些技巧可以帮助你创建更加灵活和美观的交互式可视化界面。
记住,RadioButtons 是 Matplotlib 中强大的交互式组件之一,它不仅可以用于简单的选项选择,还可以与其他图表元素结合,实现复杂的交互式数据可视化。通过灵活运用这些技巧,你可以创建出更加直观、美观和功能丰富的数据可视化作品。
在实际应用中,可能需要根据具体需求组合使用多种技巧。例如,你可能需要同时调整 RadioButtons 的大小、颜色、字体和布局,以适应特定的设计要求。此外,还要考虑 RadioButtons 与其他图表元素的协调性,确保整体视觉效果的和谐。
最后,建议在使用这些技巧时多进行实验和调试,找出最适合你的特定用例的方案。同时,也要注意保持代码的可读性和可维护性,适当地添加注释和文档,以便日后的修改和扩展。
 极客教程
极客教程