Matplotlib中如何创建马赛克图:全面指南与实例
参考:How to Make a Mosaic Plot in Matplotlib
马赛克图是一种强大的可视化工具,用于展示多个分类变量之间的关系。在数据分析和统计学中,它经常被用来探索和呈现复杂的多维数据。本文将详细介绍如何使用Python的Matplotlib库创建马赛克图,并提供多个实用示例,帮助您掌握这一技能。
1. 马赛克图简介
马赛克图,也称为马赛克显示或Marimekko图,是一种多变量图表,用于显示两个或多个分类变量之间的关系。它通过矩形区域的大小来表示数据的频率或比例,使得复杂的数据关系一目了然。
1.1 马赛克图的特点
- 直观性:通过矩形面积大小直观地展示数据比例
- 多维性:可同时展示多个分类变量之间的关系
- 比例性:能够清晰地显示不同类别之间的相对大小
1.2 马赛克图的应用场景
- 市场分析:展示不同产品在不同地区的销售情况
- 人口统计:显示不同年龄组在不同教育水平上的分布
- 医学研究:分析不同症状在不同疾病中的出现频率
2. Matplotlib基础
在开始创建马赛克图之前,让我们先回顾一下Matplotlib的基础知识。
import matplotlib.pyplot as plt
import numpy as np

# 创建一个简单的折线图
x = np.linspace(0, 10, 100)
y = np.sin(x)

plt.figure(figsize=(8, 6))
plt.plot(x, y, label='Sine Wave')
plt.title('How to matplotlib.com: Simple Line Plot')
plt.xlabel('X-axis')
plt.ylabel('Y-axis')
plt.legend()
plt.grid(True)
plt.show()
Output:
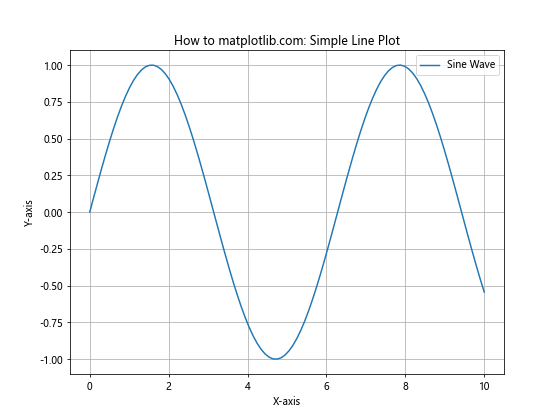
这个示例展示了Matplotlib的基本用法,包括创建图形、绘制数据、添加标题和标签等。
3. 准备数据
创建马赛克图的第一步是准备合适的数据。通常,我们需要一个包含多个分类变量的数据集。
import pandas as pd

# 创建示例数据
data = {
    'Region': ['North', 'South', 'East', 'West'] * 3,
    'Product': ['A', 'A', 'A', 'A', 'B', 'B', 'B', 'B', 'C', 'C', 'C', 'C'],
    'Sales': [100, 80, 120, 90, 150, 160, 130, 140, 200, 180, 210, 190]
}

df = pd.DataFrame(data)
print("How to matplotlib.com: Sample Data")
print(df)
Output:
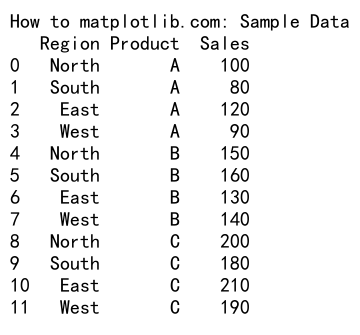
这个示例创建了一个包含地区、产品和销售额的简单数据集,我们将用它来创建马赛克图。
4. 使用Matplotlib创建基本马赛克图
虽然Matplotlib没有直接创建马赛克图的函数,但我们可以使用plt.bar函数来模拟马赛克图的效果。
import matplotlib.pyplot as plt
import pandas as pd
import numpy as np

# 准备数据
data = {
    'Category': ['A', 'A', 'B', 'B', 'C', 'C'],
    'Subcategory': ['X', 'Y'] * 3,
    'Value': [20, 30, 15, 25, 35, 15]
}
df = pd.DataFrame(data)

# 计算每个类别的总和和累积和
df['total'] = df.groupby('Category')['Value'].transform('sum')
df['cum_sum'] = df.groupby('Category')['Value'].cumsum()
df['y_coord'] = df['cum_sum'] - df['Value']

# 创建马赛克图
fig, ax = plt.subplots(figsize=(10, 6))

colors = plt.cm.Set3(np.linspace(0, 1, len(df['Subcategory'].unique())))

for i, (index, row) in enumerate(df.iterrows()):
    ax.bar(row['Category'], row['Value'], bottom=row['y_coord'],
           width=0.5, color=colors[i % len(colors)],
           label=row['Subcategory'] if i < 2 else "")

ax.set_title('How to matplotlib.com: Basic Mosaic Plot')
ax.set_xlabel('Categories')
ax.set_ylabel('Values')
ax.legend(title='Subcategories')

plt.tight_layout()
plt.show()
Output:
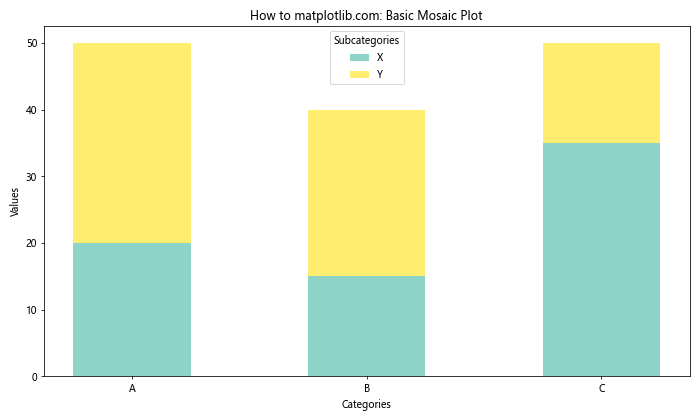
这个示例展示了如何使用Matplotlib创建一个基本的马赛克图。我们使用堆叠的条形图来模拟马赛克图的效果,每个矩形的高度代表该类别的值。
5. 添加百分比标签
为了使马赛克图更加信息丰富,我们可以在每个矩形上添加百分比标签。
import matplotlib.pyplot as plt
import pandas as pd
import numpy as np

# 准备数据
data = {
    'Category': ['A', 'A', 'B', 'B', 'C', 'C'],
    'Subcategory': ['X', 'Y'] * 3,
    'Value': [20, 30, 15, 25, 35, 15]
}
df = pd.DataFrame(data)

# 计算百分比
df['total'] = df.groupby('Category')['Value'].transform('sum')
df['percentage'] = df['Value'] / df['total'] * 100
df['cum_sum'] = df.groupby('Category')['Value'].cumsum()
df['y_coord'] = df['cum_sum'] - df['Value']

# 创建马赛克图
fig, ax = plt.subplots(figsize=(10, 6))

colors = plt.cm.Set3(np.linspace(0, 1, len(df['Subcategory'].unique())))

for i, (index, row) in enumerate(df.iterrows()):
    rect = ax.bar(row['Category'], row['Value'], bottom=row['y_coord'],
                  width=0.5, color=colors[i % len(colors)],
                  label=row['Subcategory'] if i < 2 else "")

    # 添加百分比标签
    height = rect[0].get_height()
    ax.text(rect[0].get_x() + rect[0].get_width()/2., row['y_coord'] + height/2.,
            f'{row["percentage"]:.1f}%', ha='center', va='center')

ax.set_title('How to matplotlib.com: Mosaic Plot with Percentage Labels')
ax.set_xlabel('Categories')
ax.set_ylabel('Values')
ax.legend(title='Subcategories')

plt.tight_layout()
plt.show()
Output:
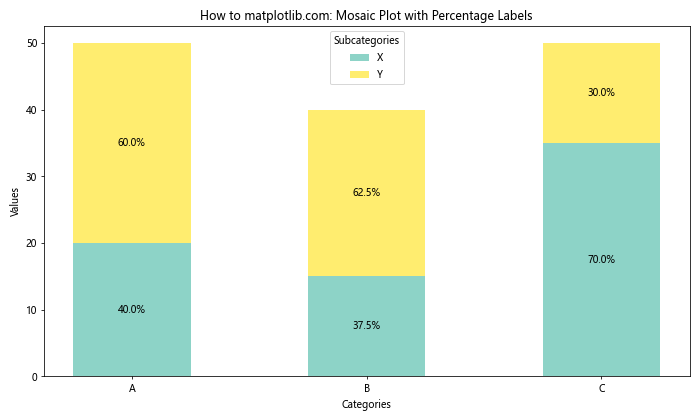
这个示例在基本马赛克图的基础上,为每个矩形添加了百分比标签,使得数据的比例关系更加清晰。
6. 调整马赛克图的宽度
在标准马赛克图中,每个类别的宽度通常与其总值成正比。我们可以通过调整条形图的宽度来实现这一效果。
import matplotlib.pyplot as plt
import pandas as pd
import numpy as np

# 准备数据
data = {
    'Category': ['A', 'A', 'B', 'B', 'C', 'C'],
    'Subcategory': ['X', 'Y'] * 3,
    'Value': [20, 30, 15, 25, 35, 15]
}
df = pd.DataFrame(data)

# 计算总和和百分比
df['total'] = df.groupby('Category')['Value'].transform('sum')
df['percentage'] = df['Value'] / df['total'] * 100
df['cum_sum'] = df.groupby('Category')['Value'].cumsum()
df['y_coord'] = df['cum_sum'] - df['Value']

# 计算宽度
total_sum = df['total'].sum()
df['width'] = df['total'] / total_sum

# 计算x坐标
df['x_coord'] = df.groupby('Category')['width'].cumsum() - df['width']

# 创建马赛克图
fig, ax = plt.subplots(figsize=(12, 6))

colors = plt.cm.Set3(np.linspace(0, 1, len(df['Subcategory'].unique())))

for i, (index, row) in enumerate(df.iterrows()):
    rect = ax.bar(row['x_coord'] + row['width']/2, row['Value'], bottom=row['y_coord'],
                  width=row['width'], color=colors[i % len(colors)],
                  label=row['Subcategory'] if i < 2 else "")

    # 添加百分比标签
    height = rect[0].get_height()
    ax.text(rect[0].get_x() + rect[0].get_width()/2., row['y_coord'] + height/2.,
            f'{row["percentage"]:.1f}%', ha='center', va='center')

ax.set_title('How to matplotlib.com: Proportional Width Mosaic Plot')
ax.set_xlabel('Categories')
ax.set_ylabel('Values')
ax.set_xticks(df.groupby('Category')['x_coord'].mean())
ax.set_xticklabels(df['Category'].unique())
ax.legend(title='Subcategories')

plt.tight_layout()
plt.show()
Output:
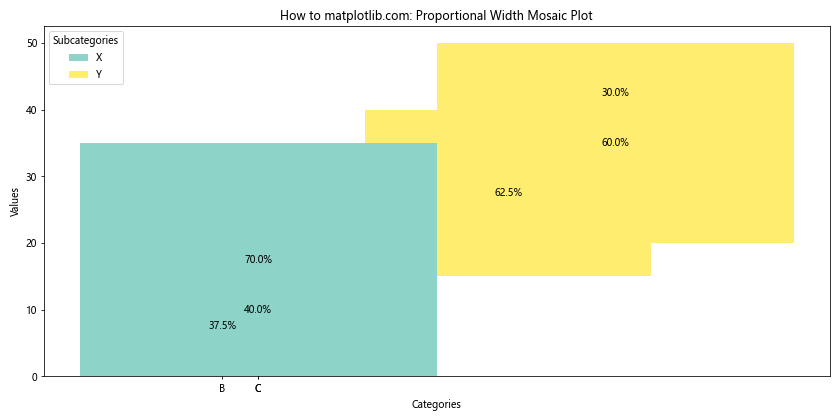
这个示例展示了如何创建一个宽度与总值成正比的马赛克图,更好地反映了各类别之间的相对大小。
7. 添加网格线
为了更容易比较不同矩形的大小,我们可以在马赛克图中添加网格线。
import matplotlib.pyplot as plt
import pandas as pd
import numpy as np

# 准备数据
data = {
    'Category': ['A', 'A', 'B', 'B', 'C', 'C'],
    'Subcategory': ['X', 'Y'] * 3,
    'Value': [20, 30, 15, 25, 35, 15]
}
df = pd.DataFrame(data)

# 计算总和和百分比
df['total'] = df.groupby('Category')['Value'].transform('sum')
df['percentage'] = df['Value'] / df['total'] * 100
df['cum_sum'] = df.groupby('Category')['Value'].cumsum()
df['y_coord'] = df['cum_sum'] - df['Value']

# 计算宽度和x坐标
total_sum = df['total'].sum()
df['width'] = df['total'] / total_sum
df['x_coord'] = df.groupby('Category')['width'].cumsum() - df['width']

# 创建马赛克图
fig, ax = plt.subplots(figsize=(12, 6))

colors = plt.cm.Set3(np.linspace(0, 1, len(df['Subcategory'].unique())))

for i, (index, row) in enumerate(df.iterrows()):
    rect = ax.bar(row['x_coord'] + row['width']/2, row['Value'], bottom=row['y_coord'],
                  width=row['width'], color=colors[i % len(colors)],
                  label=row['Subcategory'] if i < 2 else "")

    # 添加百分比标签
    height = rect[0].get_height()
    ax.text(rect[0].get_x() + rect[0].get_width()/2., row['y_coord'] + height/2.,
            f'{row["percentage"]:.1f}%', ha='center', va='center')

# 添加网格线
ax.set_axisbelow(True)
ax.yaxis.grid(True, linestyle='--', alpha=0.7)
ax.xaxis.grid(True, linestyle='--', alpha=0.7)

ax.set_title('How to matplotlib.com: Mosaic Plot with Grid Lines')
ax.set_xlabel('Categories')
ax.set_ylabel('Values')
ax.set_xticks(df.groupby('Category')['x_coord'].mean())
ax.set_xticklabels(df['Category'].unique())
ax.legend(title='Subcategories')

plt.tight_layout()
plt.show()
Output:
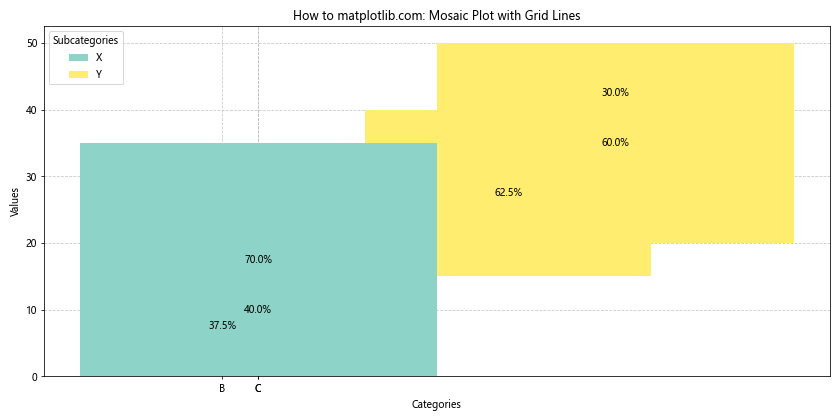
这个示例在之前的马赛克图基础上添加了网格线,使得比较不同矩形的大小变得更加容易。
8. 自定义颜色和样式
我们可以通过自定义颜色和样式来增强马赛克图的视觉吸引力。
import matplotlib.pyplot as plt
import pandas as pd
import numpy as np

# 准备数据
data = {
    'Category': ['A', 'A', 'B', 'B', 'C', 'C'],
    'Subcategory': ['X', 'Y'] * 3,
    'Value': [20, 30, 15, 25, 35, 15]
}
df = pd.DataFrame(data)

# 计算总和和百分比
df['total'] = df.groupby('Category')['Value'].transform('sum')
df['percentage'] = df['Value'] / df['total'] * 100
df['cum_sum'] = df.groupby('Category')['Value'].cumsum()
df['y_coord'] = df['cum_sum'] - df['Value']

# 计算宽度和x坐标
total_sum = df['total'].sum()
df['width'] = df['total'] / total_sum
df['x_coord'] = df.groupby('Category')['width'].cumsum() - df['width']

# 创建马赛克图
fig, ax = plt.subplots(figsize=(12, 6))

# 自定义颜色
colors = ['#FF9999', '#66B2FF', '#99FF99', '#FFCC99', '#FF99CC', '#99CCFF']

for i, (index, row) in enumerate(df.iterrows()):
    rect = ax.bar(row['x_coord'] + row['width']/2, row['Value'], bottom=row['y_coord'],
                  width=row['width'], color=colors[i], edgecolor='white', linewidth=1.5,
                  label=row['Subcategory'] if i < 2 else "")

    # 添加百分比标签
    height = rect[0].get_height()
    ax.text(rect[0].get_x() + rect[0].get_width()/2., row['y_coord'] + height/2.,
            f'{row["percentage"]:.1f}%', ha='center', va='center', fontweight='bold')

# 自定义样式
ax.set_facecolor('#F0F0F0')
ax.spines['top'].set_visible(False)
ax.spines['right'].set_visible(False)
ax.spines['left'].set_color('#CCCCCC')
ax.spines['bottom'].set_color('#CCCCCC')

ax.set_title('How to matplotlib.com: Customized Mosaic Plot', fontsize=16, fontweight='bold')
ax.set_xlabel('Categories', fontsize=12)
ax.set_ylabel('Values', fontsize=12)
ax.set_xticks(df.groupby('Category')['x_coord'].mean())
ax.set_xticklabels(df['Category'].unique(), fontsize=10)
ax.legend(title='Subcategories', title_fontsize=12, fontsize=10)

plt.tight_layout()
plt.show()
Output:
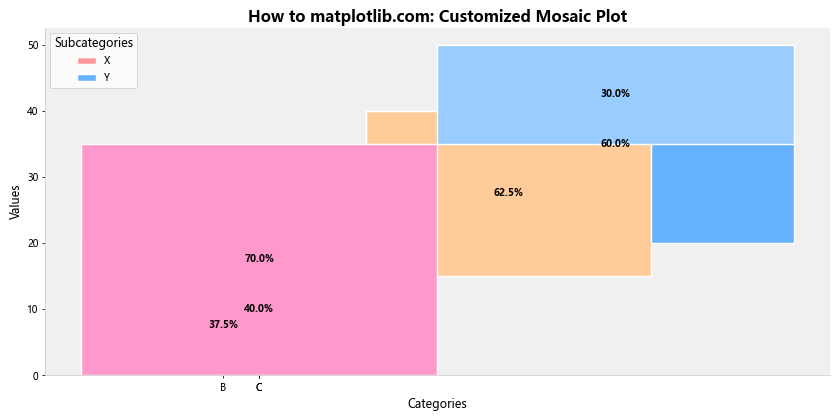
这个示例展示了如何通过自定义颜色、边框、背景和字体来创建一个更具视觉吸引力的马赛克图。
9. 处理更复杂的数据集
在实际应用中,我们可能需要处理更复杂的数据集。以下是一个处理多层次分类数据的示例。
import matplotlib.pyplot as plt
import pandas as pd
import numpy as np

# 准备更复杂的数据
data = {
    'Region': ['North', 'North', 'North', 'South', 'South', 'South', 'East', 'East', 'East', 'West', 'West', 'West'] * 2,
    'Product': ['A', 'B', 'C'] * 8,
    'Channel': ['Online', 'Online', 'Online', 'Online', 'Online', 'Online', 'Offline', 'Offline', 'Offline', 'Offline', 'Offline', 'Offline'] * 2,
    'Sales': np.random.randint(100, 1000, 24)
}
df = pd.DataFrame(data)

# 计算总和和百分比
df['total'] = df.groupby('Region')['Sales'].transform('sum')
df['percentage'] = df['Sales'] / df['total'] * 100
df['cum_sum'] = df.groupby(['Region', 'Channel'])['Sales'].cumsum()
df['y_coord'] = df['cum_sum'] - df['Sales']

# 计算宽度和x坐标
total_sum = df['total'].sum()
df['width'] = df['total'] / total_sum
df['x_coord'] = df.groupby('Region')['width'].cumsum() - df['width']

# 创建马赛克图
fig, ax = plt.subplots(figsize=(15, 8))

colors = plt.cm.Set3(np.linspace(0, 1, len(df['Product'].unique())))
channel_offset = {'Online': 0, 'Offline': 0.5}

for i, (index, row) in enumerate(df.iterrows()):
    rect = ax.bar(row['x_coord'] + row['width']/2 + channel_offset[row['Channel']]*row['width']/2,
                  row['Sales'], bottom=row['y_coord'],
                  width=row['width']/2, color=colors[i % len(colors)],
                  label=row['Product'] if i < 3 else "")

    # 添加百分比标签(只为较大的矩形添加标签)
    if row['percentage'] > 5:
        height = rect[0].get_height()
        ax.text(rect[0].get_x() + rect[0].get_width()/2., row['y_coord'] + height/2.,
                f'{row["percentage"]:.1f}%', ha='center', va='center', fontsize=8)

ax.set_title('How to matplotlib.com: Complex Mosaic Plot', fontsize=16)
ax.set_xlabel('Regions', fontsize=12)
ax.set_ylabel('Sales', fontsize=12)
ax.set_xticks(df.groupby('Region')['x_coord'].mean())
ax.set_xticklabels(df['Region'].unique())
ax.legend(title='Products', bbox_to_anchor=(1.05, 1), loc='upper left')

# 添加Channel标签
for region in df['Region'].unique():
    x = df[df['Region'] == region]['x_coord'].iloc[0]
    width = df[df['Region'] == region]['width'].iloc[0]
    ax.text(x + width/4, ax.get_ylim()[1], 'Online', ha='center', va='bottom', fontsize=10)
    ax.text(x + 3*width/4, ax.get_ylim()[1], 'Offline', ha='center', va='bottom', fontsize=10)

plt.tight_layout()
plt.show()
Output:
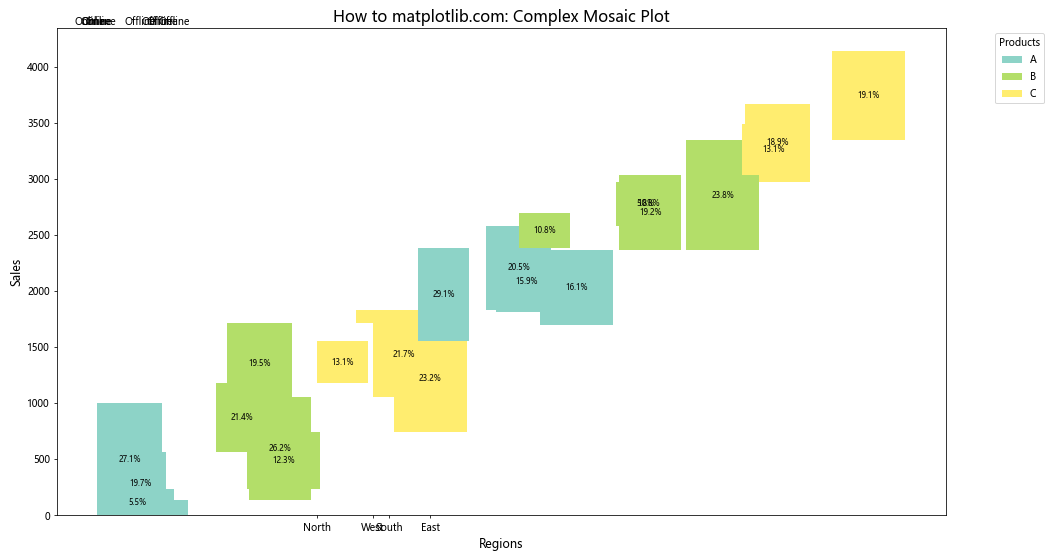
这个示例展示了如何处理包含多个分类变量(地区、产品、销售渠道)的复杂数据集,并创建一个多层次的马赛克图。
10. 添加交互性
虽然Matplotlib主要用于创建静态图表,但我们可以结合使用其他库(如ipywidgets)来为马赛克图添加一些交互性。
import matplotlib.pyplot as plt
import pandas as pd
import numpy as np
from ipywidgets import interact, widgets

# 准备数据
data = {
    'Region': ['North', 'South', 'East', 'West'] * 3,
    'Product': ['A', 'A', 'A', 'A', 'B', 'B', 'B', 'B', 'C', 'C', 'C', 'C'],
    'Sales': [100, 80, 120, 90, 150, 160, 130, 140, 200, 180, 210, 190]
}
df = pd.DataFrame(data)

def plot_mosaic(selected_products):
    # 过滤数据
    filtered_df = df[df['Product'].isin(selected_products)]

    # 计算总和和百分比
    filtered_df['total'] = filtered_df.groupby('Region')['Sales'].transform('sum')
    filtered_df['percentage'] = filtered_df['Sales'] / filtered_df['total'] * 100
    filtered_df['cum_sum'] = filtered_df.groupby('Region')['Sales'].cumsum()
    filtered_df['y_coord'] = filtered_df['cum_sum'] - filtered_df['Sales']

    # 计算宽度和x坐标
    total_sum = filtered_df['total'].sum()
    filtered_df['width'] = filtered_df['total'] / total_sum
    filtered_df['x_coord'] = filtered_df.groupby('Region')['width'].cumsum() - filtered_df['width']

    # 创建马赛克图
    fig, ax = plt.subplots(figsize=(12, 6))

    colors = plt.cm.Set3(np.linspace(0, 1, len(filtered_df['Product'].unique())))

    for i, (index, row) in enumerate(filtered_df.iterrows()):
        rect = ax.bar(row['x_coord'] + row['width']/2, row['Sales'], bottom=row['y_coord'],
                      width=row['width'], color=colors[i % len(colors)],
                      label=row['Product'] if i < len(selected_products) else "")

        # 添加百分比标签
        height = rect[0].get_height()
        ax.text(rect[0].get_x() + rect[0].get_width()/2., row['y_coord'] + height/2.,
                f'{row["percentage"]:.1f}%', ha='center', va='center')

    ax.set_title('How to matplotlib.com: Interactive Mosaic Plot')
    ax.set_xlabel('Regions')
    ax.set_ylabel('Sales')
    ax.set_xticks(filtered_df.groupby('Region')['x_coord'].mean())
    ax.set_xticklabels(filtered_df['Region'].unique())
    ax.legend(title='Products')

    plt.tight_layout()
    plt.show()

# 创建交互式控件
product_selector = widgets.SelectMultiple(
    options=df['Product'].unique(),
    value=['A', 'B', 'C'],
    description='Products:',
    disabled=False
)

interact(plot_mosaic, selected_products=product_selector)
这个示例展示了如何使用ipywidgets创建一个交互式的马赛克图,允许用户选择要显示的产品。
11. 添加注释和解释
为了使马赛克图更具信息性,我们可以添加注释和解释来突出重要的数据点或趋势。
import matplotlib.pyplot as plt
import pandas as pd
import numpy as np

# 准备数据
data = {
    'Category': ['A', 'A', 'B', 'B', 'C', 'C'],
    'Subcategory': ['X', 'Y'] * 3,
    'Value': [20, 30, 15, 25, 35, 15]
}
df = pd.DataFrame(data)

# 计算总和和百分比
df['total'] = df.groupby('Category')['Value'].transform('sum')
df['percentage'] = df['Value'] / df['total'] * 100
df['cum_sum'] = df.groupby('Category')['Value'].cumsum()
df['y_coord'] = df['cum_sum'] - df['Value']

# 计算宽度和x坐标
total_sum = df['total'].sum()
df['width'] = df['total'] / total_sum
df['x_coord'] = df.groupby('Category')['width'].cumsum() - df['width']

# 创建马赛克图
fig, ax = plt.subplots(figsize=(12, 8))

colors = plt.cm.Set3(np.linspace(0, 1, len(df['Subcategory'].unique())))

for i, (index, row) in enumerate(df.iterrows()):
    rect = ax.bar(row['x_coord'] + row['width']/2, row['Value'], bottom=row['y_coord'],
                  width=row['width'], color=colors[i % len(colors)],
                  label=row['Subcategory'] if i < 2 else "")

    # 添加百分比标签
    height = rect[0].get_height()
    ax.text(rect[0].get_x() + rect[0].get_width()/2., row['y_coord'] + height/2.,
            f'{row["percentage"]:.1f}%', ha='center', va='center')

# 添加注释
max_value = df['Value'].max()
max_row = df.loc[df['Value'] == max_value].iloc[0]
ax.annotate('Highest Value',
            xy=(max_row['x_coord'] + max_row['width']/2, max_row['y_coord'] + max_value/2),
            xytext=(0.8, 0.95), textcoords='axes fraction',
            arrowprops=dict(facecolor='black', shrink=0.05),
            horizontalalignment='right', verticalalignment='top')

# 添加解释文本
ax.text(0.02, 0.02, 'How to matplotlib.com:\nThis mosaic plot shows the distribution of values\nacross different categories and subcategories.\nThe size of each rectangle represents the relative value,\nand the percentages indicate the proportion within each category.',
        transform=ax.transAxes, fontsize=10, verticalalignment='bottom')

ax.set_title('Annotated Mosaic Plot', fontsize=16)
ax.set_xlabel('Categories')
ax.set_ylabel('Values')
ax.set_xticks(df.groupby('Category')['x_coord'].mean())
ax.set_xticklabels(df['Category'].unique())
ax.legend(title='Subcategories')

plt.tight_layout()
plt.show()
Output:
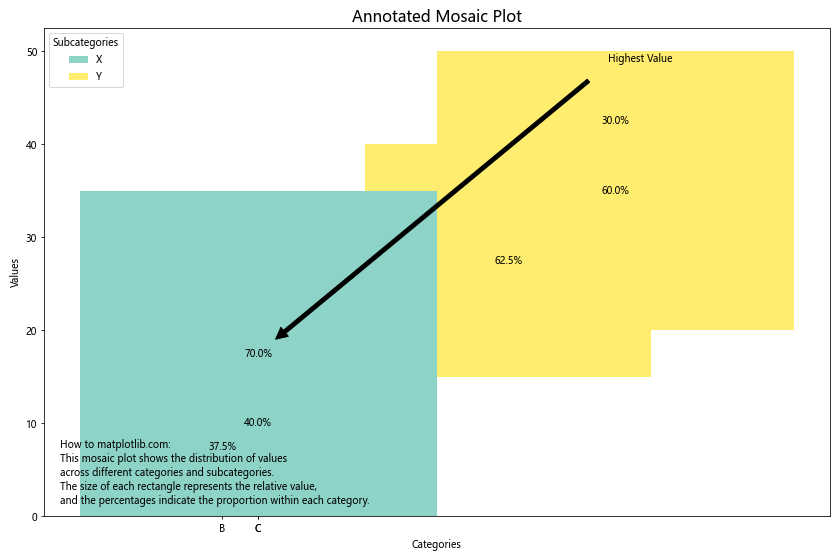
这个示例展示了如何在马赛克图中添加注释和解释文本,以提供更多上下文信息和突出重要的数据点。
12. 结合其他图表类型
马赛克图可以与其他类型的图表结合使用,以提供更全面的数据视图。以下是一个将马赛克图与条形图结合的示例。
import matplotlib.pyplot as plt
import pandas as pd
import numpy as np

# 准备数据
data = {
    'Category': ['A', 'A', 'B', 'B', 'C', 'C'],
    'Subcategory': ['X', 'Y'] * 3,
    'Value': [20, 30, 15, 25, 35, 15],
    'ExtraMetric': [5, 8, 3, 6, 9, 4]
}
df = pd.DataFrame(data)

# 计算总和和百分比
df['total'] = df.groupby('Category')['Value'].transform('sum')
df['percentage'] = df['Value'] / df['total'] * 100
df['cum_sum'] = df.groupby('Category')['Value'].cumsum()
df['y_coord'] = df['cum_sum'] - df['Value']

# 计算宽度和x坐标
total_sum = df['total'].sum()
df['width'] = df['total'] / total_sum
df['x_coord'] = df.groupby('Category')['width'].cumsum() - df['width']

# 创建图形和子图
fig, (ax1, ax2) = plt.subplots(2, 1, figsize=(12, 12), height_ratios=[3, 1])

# 绘制马赛克图
colors = plt.cm.Set3(np.linspace(0, 1, len(df['Subcategory'].unique())))

for i, (index, row) in enumerate(df.iterrows()):
    rect = ax1.bar(row['x_coord'] + row['width']/2, row['Value'], bottom=row['y_coord'],
                   width=row['width'], color=colors[i % len(colors)],
                   label=row['Subcategory'] if i < 2 else "")

    # 添加百分比标签
    height = rect[0].get_height()
    ax1.text(rect[0].get_x() + rect[0].get_width()/2., row['y_coord'] + height/2.,
             f'{row["percentage"]:.1f}%', ha='center', va='center')

ax1.set_title('How to matplotlib.com: Combined Mosaic and Bar Plot', fontsize=16)
ax1.set_xlabel('Categories')
ax1.set_ylabel('Values')
ax1.set_xticks(df.groupby('Category')['x_coord'].mean())
ax1.set_xticklabels(df['Category'].unique())
ax1.legend(title='Subcategories')

# 绘制条形图
ax2.bar(df['Category'] + ' - ' + df['Subcategory'], df['ExtraMetric'], color='lightblue')
ax2.set_xlabel('Categories and Subcategories')
ax2.set_ylabel('Extra Metric')
ax2.set_title('Additional Metric by Category and Subcategory')
plt.setp(ax2.get_xticklabels(), rotation=45, ha='right')

plt.tight_layout()
plt.show()
Output:
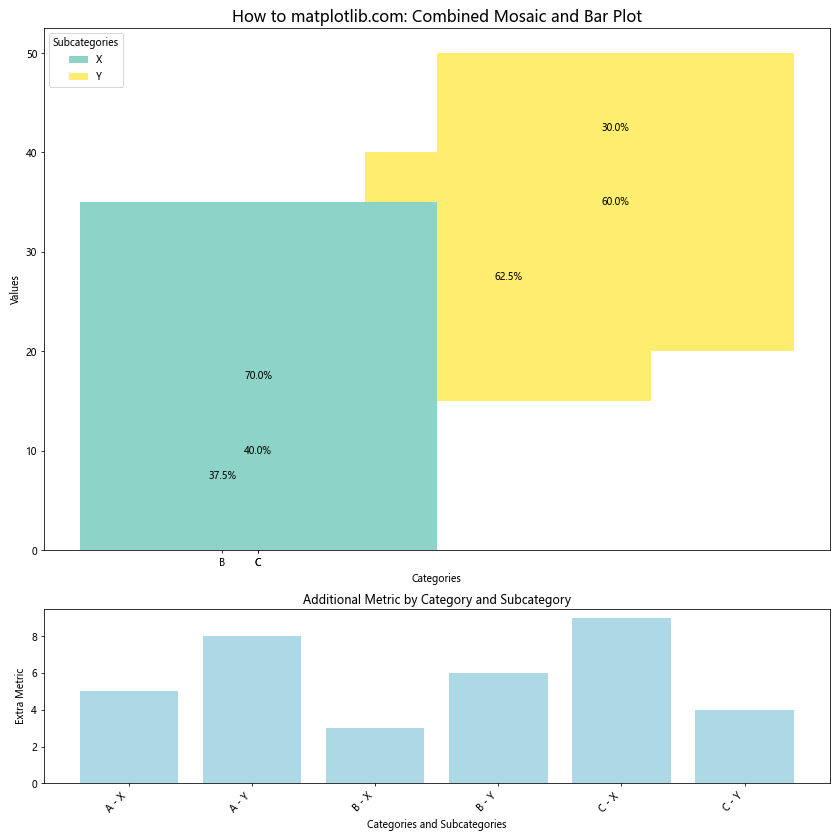
这个示例展示了如何将马赛克图与条形图结合,以同时显示主要数据和额外的度量指标。
13. 处理缺失数据
在实际应用中,我们可能会遇到包含缺失值的数据集。以下是一个处理缺失数据的马赛克图示例。
import matplotlib.pyplot as plt
import pandas as pd
import numpy as np

# 准备包含缺失值的数据
data = {
    'Category': ['A', 'A', 'B', 'B', 'C', 'C'],
    'Subcategory': ['X', 'Y'] * 3,
    'Value': [20, 30, np.nan, 25, 35, 15]
}
df = pd.DataFrame(data)

# 处理缺失值
df['Value'] = df['Value'].fillna(df['Value'].mean())

# 计算总和和百分比
df['total'] = df.groupby('Category')['Value'].transform('sum')
df['percentage'] = df['Value'] / df['total'] * 100
df['cum_sum'] = df.groupby('Category')['Value'].cumsum()
df['y_coord'] = df['cum_sum'] - df['Value']

# 计算宽度和x坐标
total_sum = df['total'].sum()
df['width'] = df['total'] / total_sum
df['x_coord'] = df.groupby('Category')['width'].cumsum() - df['width']

# 创建马赛克图
fig, ax = plt.subplots(figsize=(12, 6))

colors = plt.cm.Set3(np.linspace(0, 1, len(df['Subcategory'].unique())))

for i, (index, row) in enumerate(df.iterrows()):
    rect = ax.bar(row['x_coord'] + row['width']/2, row['Value'], bottom=row['y_coord'],
                  width=row['width'], color=colors[i % len(colors)],
                  label=row['Subcategory'] if i < 2 else "")

    # 添加百分比标签
    height = rect[0].get_height()
    ax.text(rect[0].get_x() + rect[0].get_width()/2., row['y_coord'] + height/2.,
            f'{row["percentage"]:.1f}%', ha='center', va='center')

    # 标记填充的缺失值
    if pd.isna(data['Value'][i]):
        ax.text(rect[0].get_x() + rect[0].get_width()/2., row['y_coord'] + height + 1,
                'Filled', ha='center', va='bottom', fontsize=8, color='red')

ax.set_title('How to matplotlib.com: Mosaic Plot with Handled Missing Data', fontsize=16)
ax.set_xlabel('Categories')
ax.set_ylabel('Values')
ax.set_xticks(df.groupby('Category')['x_coord'].mean())
ax.set_xticklabels(df['Category'].unique())
ax.legend(title='Subcategories')

plt.tight_layout()
plt.show()
Output:
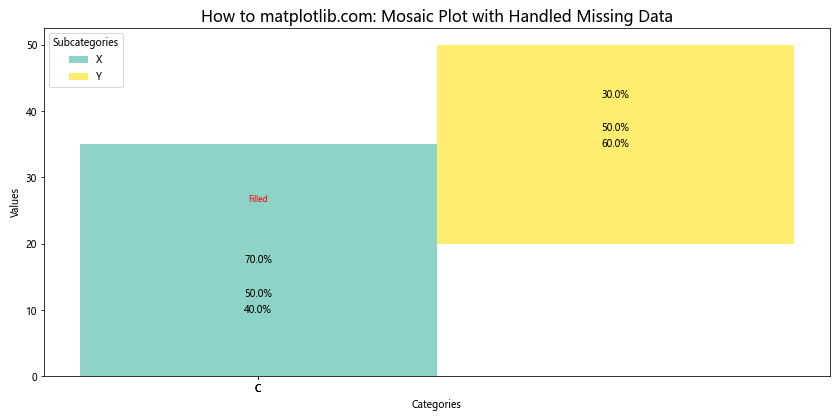
这个示例展示了如何处理包含缺失值的数据集,并在马赛克图中标记出填充的数据点。
14. 创建动态马赛克图
虽然Matplotlib主要用于静态图表,但我们可以创建一系列图表来模拟动态效果,例如展示数据随时间的变化。
import matplotlib.pyplot as plt
import pandas as pd
import numpy as np
from matplotlib.animation import FuncAnimation

# 准备随时间变化的数据
np.random.seed(42)
categories = ['A', 'B', 'C']
subcategories = ['X', 'Y']
time_periods = 10

data = {
    'Category': categories * 2 * time_periods,
    'Subcategory': subcategories * 3 * time_periods,
    'Time': sorted([f'T{i}' for i in range(time_periods)] * 6),
    'Value': np.random.randint(10, 100, 60)
}
df = pd.DataFrame(data)

# 创建图形和轴
fig, ax = plt.subplots(figsize=(12, 6))

def update(frame):
    ax.clear()

    # 过滤特定时间段的数据
    time_df = df[df['Time'] == f'T{frame}']

    # 计算总和和百分比
    time_df['total'] = time_df.groupby('Category')['Value'].transform('sum')
    time_df['percentage'] = time_df['Value'] / time_df['total'] * 100
    time_df['cum_sum'] = time_df.groupby('Category')['Value'].cumsum()
    time_df['y_coord'] = time_df['cum_sum'] - time_df['Value']

    # 计算宽度和x坐标
    total_sum = time_df['total'].sum()
    time_df['width'] = time_df['total'] / total_sum
    time_df['x_coord'] = time_df.groupby('Category')['width'].cumsum() - time_df['width']

    colors = plt.cm.Set3(np.linspace(0, 1, len(time_df['Subcategory'].unique())))

    for i, (index, row) in enumerate(time_df.iterrows()):
        rect = ax.bar(row['x_coord'] + row['width']/2, row['Value'], bottom=row['y_coord'],
                      width=row['width'], color=colors[i % len(colors)],
                      label=row['Subcategory'] if i < 2 else "")

        # 添加百分比标签
        height = rect[0].get_height()
        ax.text(rect[0].get_x() + rect[0].get_width()/2., row['y_coord'] + height/2.,
                f'{row["percentage"]:.1f}%', ha='center', va='center')

    ax.set_title(f'How to matplotlib.com: Dynamic Mosaic Plot (Time: T{frame})', fontsize=16)
    ax.set_xlabel('Categories')
    ax.set_ylabel('Values')
    ax.set_xticks(time_df.groupby('Category')['x_coord'].mean())
    ax.set_xticklabels(time_df['Category'].unique())
    ax.legend(title='Subcategories')

# 创建动画
anim = FuncAnimation(fig, update, frames=time_periods, repeat=True, interval=1000)

plt.tight_layout()
plt.show()
Output:
这个示例创建了一个动态的马赛克图,展示了数据随时间变化的情况。
15. 总结
马赛克图是一种强大的可视化工具,特别适合展示多个分类变量之间的关系。通过本文的详细介绍和多个示例,我们学习了如何使用Matplotlib创建各种类型的马赛克图,包括基本的马赛克图、添加百分比标签、调整宽度、自定义样式、处理复杂数据集、添加交互性和注释等。
关键点总结:
- 马赛克图通过矩形面积大小直观地展示数据比例。
- 使用Matplotlib的
bar函数可以模拟马赛克图的效果。 - 添加百分比标签可以增加图表的信息量。
- 调整矩形宽度可以更好地反映类别之间的相对大小。
- 自定义颜色和样式可以增强图表的视觉吸引力。
- 处理复杂数据集时,可以使用多层次的分类和颜色编码。
- 结合其他图表类型可以提供更全面的数据视图。
- 处理缺失数据和创建动态图表是实际应用中的重要技能。
通过掌握这些技巧,您可以创建出既信息丰富又视觉吸引的马赛克图,有效地传达复杂的多维数据关系。在数据分析和可视化过程中,马赛克图无疑是一个值得掌握的重要工具。
 极客教程
极客教程