如何在Matplotlib中标记数据点
参考:how to label points in matplotlib
在数据可视化中,标记数据点是一种非常有用的技巧,它可以让读者更加直观地理解数据分布和关系。在Matplotlib中,我们可以通过一些方法来标记数据点,下面将介绍一些常用的技巧。
使用annotate方法标记数据点
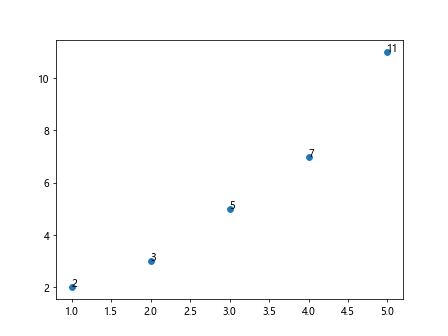
annotate方法可以在图表中添加标签,常用于标记数据点或者添加注释。下面是一个简单的示例代码:
import matplotlib.pyplot as plt

x = [1, 2, 3, 4, 5]
y = [2, 3, 5, 7, 11]

plt.scatter(x, y)

for i, txt in enumerate(y):
    plt.annotate(txt, (x[i], y[i]))

plt.show()
Output:
使用text方法标记数据点
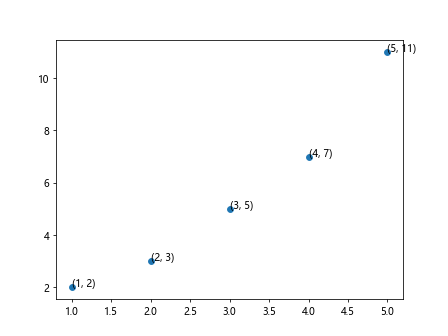
除了annotate方法,我们还可以使用text方法在数据点旁边添加文本标签。下面是一个示例代码:
import matplotlib.pyplot as plt

x = [1, 2, 3, 4, 5]
y = [2, 3, 5, 7, 11]

plt.scatter(x, y)

for i in range(len(x)):
    plt.text(x[i], y[i], f'({x[i]}, {y[i]})')

plt.show()
Output:
在不同子图中标记数据点
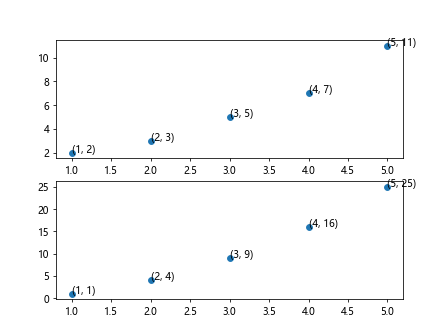
有时候我们需要在多个子图中标记数据点,可以通过subplots方法创建多个子图,并分别标记数据点。下面是一个示例代码:
import matplotlib.pyplot as plt

fig, axs = plt.subplots(2)

x1 = [1, 2, 3, 4, 5]
y1 = [2, 3, 5, 7, 11]

x2 = [1, 2, 3, 4, 5]
y2 = [1, 4, 9, 16, 25]

axs[0].scatter(x1, y1)
axs[1].scatter(x2, y2)

for i in range(len(x1)):
    axs[0].text(x1[i], y1[i], f'({x1[i]}, {y1[i]})')

for i in range(len(x2)):
    axs[1].text(x2[i], y2[i], f'({x2[i]}, {y2[i]})')

plt.show()
Output:
自定义标记样式
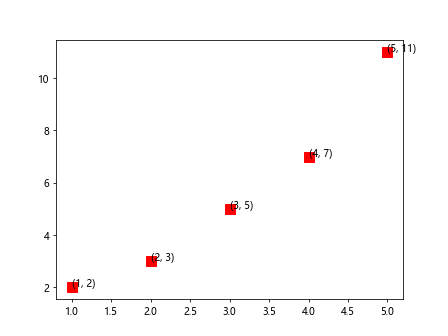
我们还可以自定义数据点的标记样式,比如改变标记的颜色、大小和形状。下面是一个示例代码:
import matplotlib.pyplot as plt

x = [1, 2, 3, 4, 5]
y = [2, 3, 5, 7, 11]

plt.scatter(x, y, color='red', s=100, marker='s')

for i in range(len(x)):
    plt.text(x[i], y[i], f'({x[i]}, {y[i]})')

plt.show()
Output:
使用标记器标记数据点
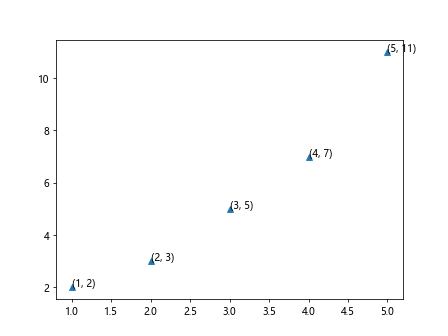
标记器(marker)是Matplotlib中用于绘制标记点的工具,我们可以根据需要选择不同的标记器来标记数据点。下面是一个示例代码:
import matplotlib.pyplot as plt

x = [1, 2, 3, 4, 5]
y = [2, 3, 5, 7, 11]

plt.scatter(x, y, marker='^')

for i in range(len(x)):
    plt.text(x[i], y[i], f'({x[i]}, {y[i]})')

plt.show()
Output:
结语
在Matplotlib中标记数据点是一项非常有用的技巧,可以让我们更好地理解数据分布和趋势。通过上面的示例代码,相信您已经掌握了在Matplotlib中如何标记数据点的方法。
 极客教程
极客教程