Matplotlib柱状图如何显示每个柱子的具体数值
参考:How to display the value of each bar in a bar chart using Matplotlib
Matplotlib是Python中最流行的数据可视化库之一,它提供了丰富的绘图功能,其中柱状图是一种常用的图表类型。在数据分析和展示中,我们经常需要在柱状图上显示每个柱子的具体数值,以便更直观地传达信息。本文将详细介绍如何使用Matplotlib在柱状图上显示每个柱子的数值,包括各种样式和布局的实现方法。
1. 基础柱状图及数值显示
首先,让我们从最基本的柱状图开始,然后逐步添加数值显示功能。
1.1 创建简单的柱状图
在开始之前,我们需要导入必要的库并创建一个简单的柱状图:
import matplotlib.pyplot as plt
import numpy as np

categories = ['A', 'B', 'C', 'D']
values = [25, 40, 30, 55]

plt.figure(figsize=(10, 6))
plt.bar(categories, values)
plt.title('Bar Chart - how2matplotlib.com')
plt.xlabel('Categories')
plt.ylabel('Values')
plt.show()
Output:
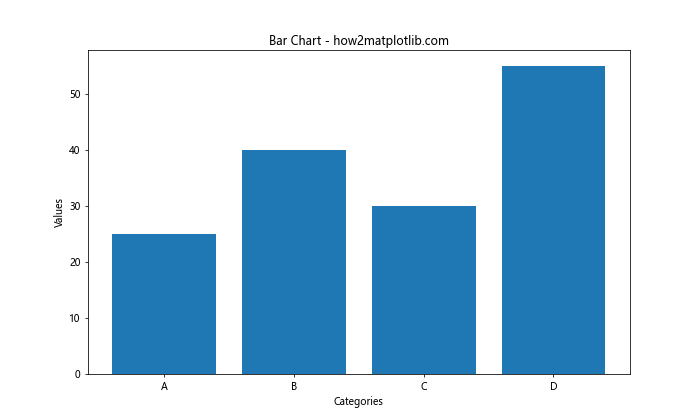
这段代码创建了一个基本的柱状图,但还没有显示具体数值。
1.2 在柱子上方显示数值
现在,让我们在每个柱子的顶部添加对应的数值:
import matplotlib.pyplot as plt
import numpy as np

categories = ['A', 'B', 'C', 'D']
values = [25, 40, 30, 55]

plt.figure(figsize=(10, 6))
bars = plt.bar(categories, values)

for bar in bars:
    height = bar.get_height()
    plt.text(bar.get_x() + bar.get_width()/2., height,
             f'{height}',
             ha='center', va='bottom')

plt.title('Bar Chart with Values - how2matplotlib.com')
plt.xlabel('Categories')
plt.ylabel('Values')
plt.show()
Output:
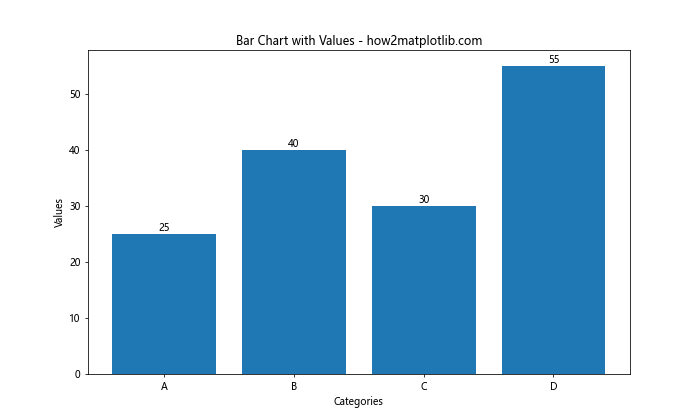
在这个例子中,我们遍历每个柱子,获取其高度,然后使用plt.text()函数在适当的位置添加文本。
2. 自定义数值显示样式
仅仅显示数值可能不够美观,我们可以通过调整文本的各种属性来改善显示效果。
2.1 调整文本颜色和大小
import matplotlib.pyplot as plt
import numpy as np

categories = ['A', 'B', 'C', 'D']
values = [25, 40, 30, 55]

plt.figure(figsize=(10, 6))
bars = plt.bar(categories, values)

for bar in bars:
    height = bar.get_height()
    plt.text(bar.get_x() + bar.get_width()/2., height,
             f'{height}',
             ha='center', va='bottom',
             color='red', fontweight='bold', fontsize=12)

plt.title('Bar Chart with Styled Values - how2matplotlib.com')
plt.xlabel('Categories')
plt.ylabel('Values')
plt.show()
Output:
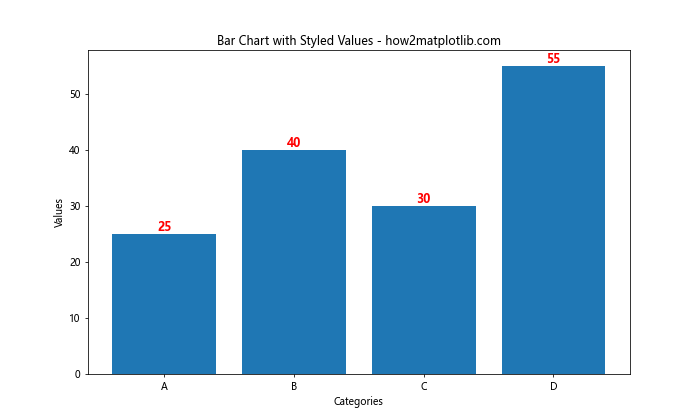
这个例子中,我们将文本颜色设置为红色,字体加粗,并增大了字号。
2.2 添加背景和边框
为了使数值更加醒目,我们可以为文本添加背景色和边框:
import matplotlib.pyplot as plt
import numpy as np

categories = ['A', 'B', 'C', 'D']
values = [25, 40, 30, 55]

plt.figure(figsize=(10, 6))
bars = plt.bar(categories, values)

for bar in bars:
    height = bar.get_height()
    plt.text(bar.get_x() + bar.get_width()/2., height,
             f'{height}',
             ha='center', va='bottom',
             bbox=dict(facecolor='white', edgecolor='gray', boxstyle='round,pad=0.5'))

plt.title('Bar Chart with Boxed Values - how2matplotlib.com')
plt.xlabel('Categories')
plt.ylabel('Values')
plt.show()
Output:
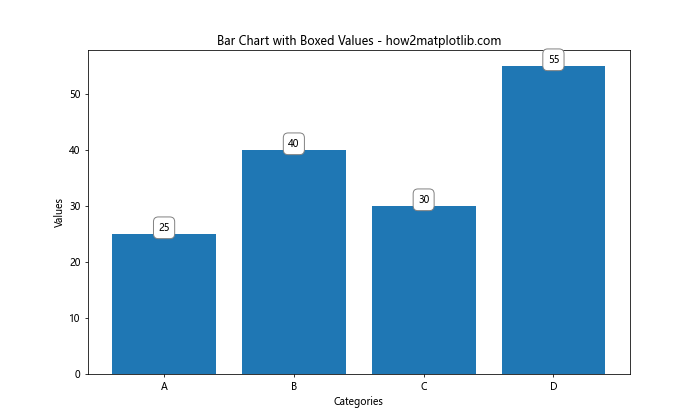
这里我们使用bbox参数为文本添加了一个白色背景和灰色边框的圆角矩形。
3. 处理负值和零值
在实际应用中,我们可能会遇到负值或零值的情况,这需要特殊处理。
3.1 处理负值
对于负值,我们需要调整文本的位置:
import matplotlib.pyplot as plt
import numpy as np

categories = ['A', 'B', 'C', 'D', 'E']
values = [25, -40, 30, -55, 60]

plt.figure(figsize=(10, 6))
bars = plt.bar(categories, values)

for bar in bars:
    height = bar.get_height()
    plt.text(bar.get_x() + bar.get_width()/2.,
             height if height >= 0 else height - 3,
             f'{height}',
             ha='center', va='bottom' if height >= 0 else 'top')

plt.title('Bar Chart with Positive and Negative Values - how2matplotlib.com')
plt.xlabel('Categories')
plt.ylabel('Values')
plt.axhline(y=0, color='k', linestyle='-', linewidth=0.5)
plt.show()
Output:
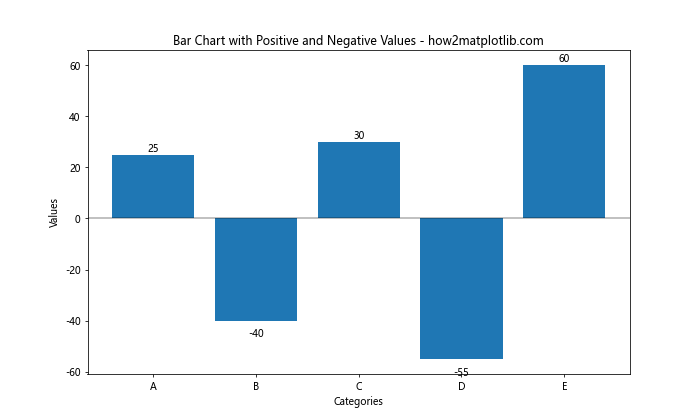
这个例子中,我们根据值的正负来调整文本的垂直对齐方式和位置。
3.2 处理零值
对于零值,我们可能需要特别处理以确保它们也能被显示:
import matplotlib.pyplot as plt
import numpy as np

categories = ['A', 'B', 'C', 'D', 'E']
values = [25, 0, 30, -55, 60]

plt.figure(figsize=(10, 6))
bars = plt.bar(categories, values)

for bar in bars:
    height = bar.get_height()
    plt.text(bar.get_x() + bar.get_width()/2.,
             height if height != 0 else 0.5,
             f'{height}',
             ha='center', va='bottom' if height >= 0 else 'top')

plt.title('Bar Chart with Zero Values - how2matplotlib.com')
plt.xlabel('Categories')
plt.ylabel('Values')
plt.axhline(y=0, color='k', linestyle='-', linewidth=0.5)
plt.ylim(bottom=min(values)-5, top=max(values)+5)
plt.show()
Output:
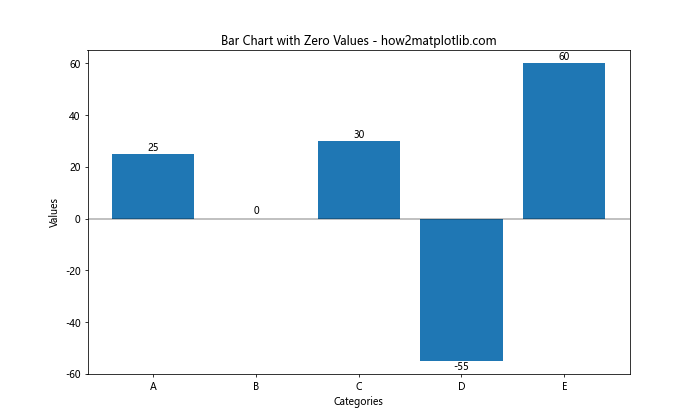
在这个例子中,我们为零值设置了一个小的偏移量,以确保它们的标签可见。
4. 处理大量数据
当处理大量数据时,我们需要考虑如何有效地显示所有的数值而不使图表变得杂乱。
4.1 旋转标签
对于大量数据,我们可以旋转标签以节省空间:
import matplotlib.pyplot as plt
import numpy as np

categories = [f'Category {i}' for i in range(20)]
values = np.random.randint(10, 100, 20)

plt.figure(figsize=(15, 8))
bars = plt.bar(categories, values)

for bar in bars:
    height = bar.get_height()
    plt.text(bar.get_x() + bar.get_width()/2., height,
             f'{height}',
             ha='center', va='bottom', rotation=90)

plt.title('Bar Chart with Rotated Labels - how2matplotlib.com')
plt.xlabel('Categories')
plt.ylabel('Values')
plt.xticks(rotation=45, ha='right')
plt.tight_layout()
plt.show()
Output:
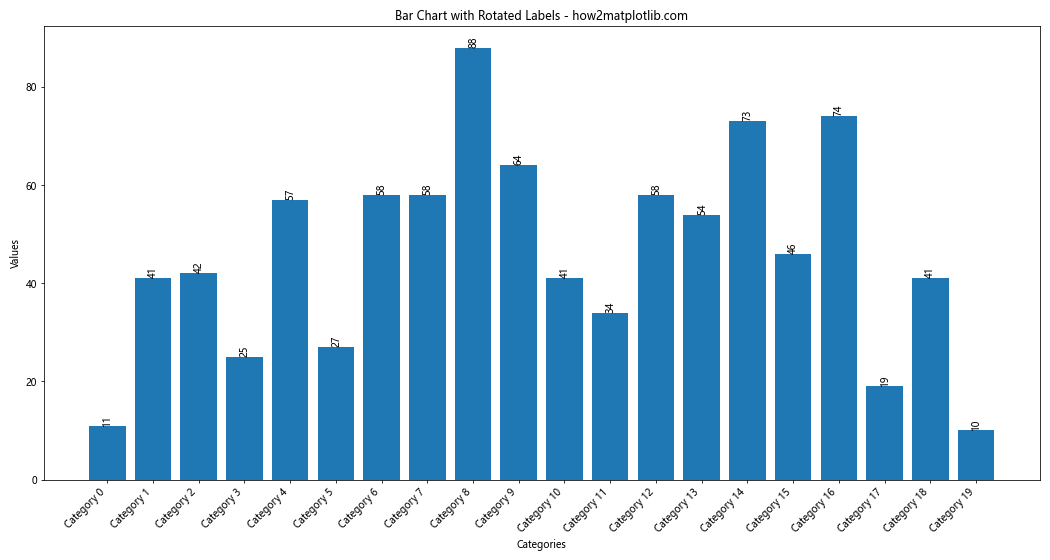
这个例子中,我们将数值标签和x轴标签都进行了旋转,以适应更多的数据。
4.2 使用对数刻度
当数值范围很大时,使用对数刻度可以更好地展示数据:
import matplotlib.pyplot as plt
import numpy as np

categories = [f'Category {i}' for i in range(10)]
values = np.random.randint(1, 10000, 10)

plt.figure(figsize=(12, 6))
bars = plt.bar(categories, values)

for bar in bars:
    height = bar.get_height()
    plt.text(bar.get_x() + bar.get_width()/2., height,
             f'{height}',
             ha='center', va='bottom')

plt.title('Bar Chart with Logarithmic Scale - how2matplotlib.com')
plt.xlabel('Categories')
plt.ylabel('Values (log scale)')
plt.yscale('log')
plt.tight_layout()
plt.show()
Output:
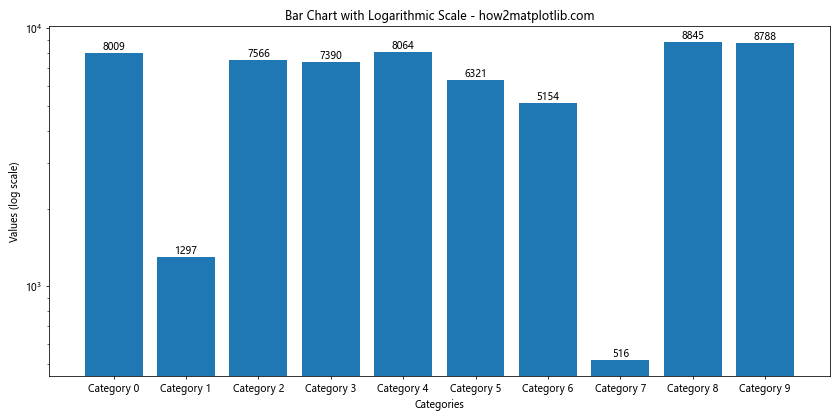
这个例子使用了对数刻度,使得大范围的数值都能清晰地显示。
5. 分组柱状图中显示数值
分组柱状图是另一种常见的图表类型,我们也需要在其中显示数值。
5.1 基本分组柱状图
首先,让我们创建一个基本的分组柱状图并显示数值:
import matplotlib.pyplot as plt
import numpy as np

categories = ['A', 'B', 'C', 'D']
group1 = [20, 35, 30, 35]
group2 = [25, 32, 34, 20]

x = np.arange(len(categories))
width = 0.35

fig, ax = plt.subplots(figsize=(12, 6))
rects1 = ax.bar(x - width/2, group1, width, label='Group 1')
rects2 = ax.bar(x + width/2, group2, width, label='Group 2')

def autolabel(rects):
    for rect in rects:
        height = rect.get_height()
        ax.annotate(f'{height}',
                    xy=(rect.get_x() + rect.get_width() / 2, height),
                    xytext=(0, 3),  # 3 points vertical offset
                    textcoords="offset points",
                    ha='center', va='bottom')

autolabel(rects1)
autolabel(rects2)

ax.set_title('Grouped Bar Chart with Values - how2matplotlib.com')
ax.set_xlabel('Categories')
ax.set_ylabel('Values')
ax.set_xticks(x)
ax.set_xticklabels(categories)
ax.legend()

plt.tight_layout()
plt.show()
Output:
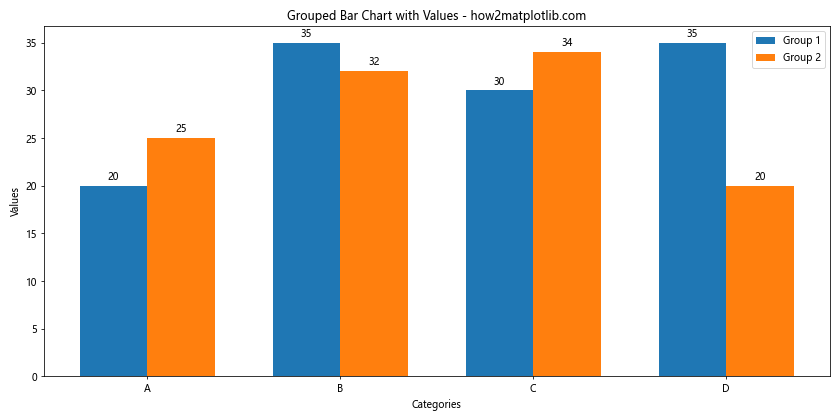
这个例子创建了一个分组柱状图,并为每个柱子添加了数值标签。
5.2 堆叠柱状图中显示数值
堆叠柱状图是另一种展示多组数据的方式,我们也可以在其中显示数值:
import matplotlib.pyplot as plt
import numpy as np

categories = ['A', 'B', 'C', 'D']
group1 = [20, 35, 30, 35]
group2 = [25, 32, 34, 20]

fig, ax = plt.subplots(figsize=(12, 6))
bars1 = ax.bar(categories, group1, label='Group 1')
bars2 = ax.bar(categories, group2, bottom=group1, label='Group 2')

def autolabel(bars, offset=0):
    for bar in bars:
        height = bar.get_height()
        ax.text(bar.get_x() + bar.get_width()/2., bar.get_y() + height/2 + offset,
                f'{height}',
                ha='center', va='center')

autolabel(bars1)
autolabel(bars2, offset=np.array(group1))

ax.set_title('Stacked Bar Chart with Values - how2matplotlib.com')
ax.set_xlabel('Categories')
ax.set_ylabel('Values')
ax.legend()

plt.tight_layout()
plt.show()
在这个例子中,我们为堆叠柱状图的每一层都添加了数值标签。
6. 水平柱状图中显示数值
水平柱状图在某些情况下可能更适合展示数据,我们同样需要在其中显示数值。
6.1 基本水平柱状图
让我们创建一个基本的水平柱状图并显示数值:
import matplotlib.pyplot as plt
import numpy as np

categories = ['Category A', 'Category B', 'Category C', 'Category D', 'Category E']
values = [25, 40, 30, 55, 60]

fig, ax = plt.subplots(figsize=(10, 6))
bars = ax.barh(categories, values)

for bar in bars:
    width = bar.get_width()
    ax.text(width, bar.get_y() + bar.get_height()/2,
            f'{width}',
            ha='left', va='center')

ax.set_title('Horizontal Bar Chart with Values - how2matplotlib.com')
ax.set_xlabel('Values')
ax.set_ylabel('Categories')

plt.tight_layout()
plt.show()
Output:
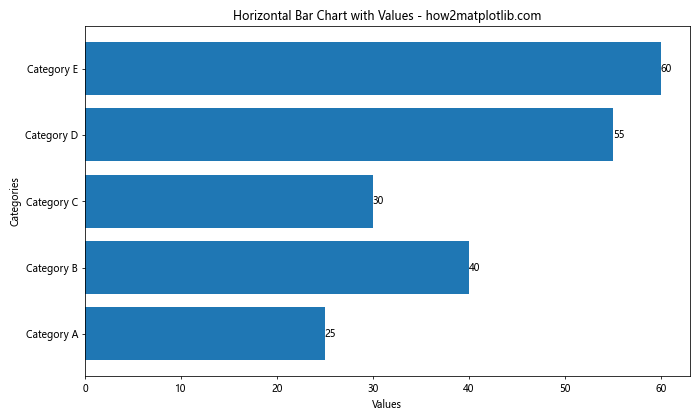
这个例子创建了一个水平柱状图,并在每个柱子的右侧显示了对应的数值。
6.2 分组水平柱状图
我们也可以创建分组水平柱状图并显示数值:
import matplotlib.pyplot as plt
import numpy as np

categories = ['A', 'B', 'C', 'D']
group1 = [20, 35, 30, 35]
group2 = [25, 32, 34, 20]

y = np.arange(len(categories))
height = 0.35

fig, ax = plt.subplots(figsize=(12, 6))
bars1 = ax.barh(y - height/2, group1, height, label='Group 1')
bars2 = ax.barh(y + height/2, group2, height, label='Group 2')

def autolabel(bars):
    for bar in bars:
        width = bar.get_width()
        ax.text(width, bar.get_y() + bar.get_height()/2,
                f'{width}',
                ha='left', va='center')

autolabel(bars1)
autolabel(bars2)

ax.set_title('Grouped Horizontal Bar Chart with Values - how2matplotlib.com')
ax.set_xlabel('Values')
ax.set_yticks(y)
ax.set_yticklabels(categories)
ax.legend()

plt.tight_layout()
plt.show()
Output:
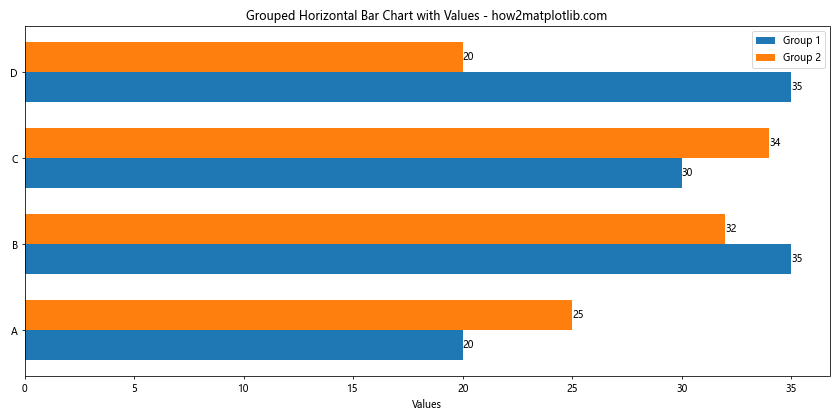
这个例子展示了如何在分组水平柱状图中为每个柱子添加数值标签。
7. 自定义数值格式
有时我们需要对显示的数值进行格式化,以便更好地展示信息。
7.1 显示百分比
当数据表示百分比时,我们可以在数值后添加百分号:
import matplotlib.pyplot as plt
import numpy as np

categories = ['A', 'B', 'C', 'D']
values = [0.25, 0.4, 0.3, 0.55]

plt.figure(figsize=(10, 6))
bars = plt.bar(categories, values)

for bar in bars:
    height = bar.get_height()
    plt.text(bar.get_x() + bar.get_width()/2., height,
             f'{height:.1%}',
             ha='center', va='bottom')

plt.title('Bar Chart with Percentage Values - how2matplotlib.com')
plt.xlabel('Categories')
plt.ylabel('Percentage')
plt.ylim(0, max(values) * 1.1)  # 为标签留出空间
plt.show()
Output:
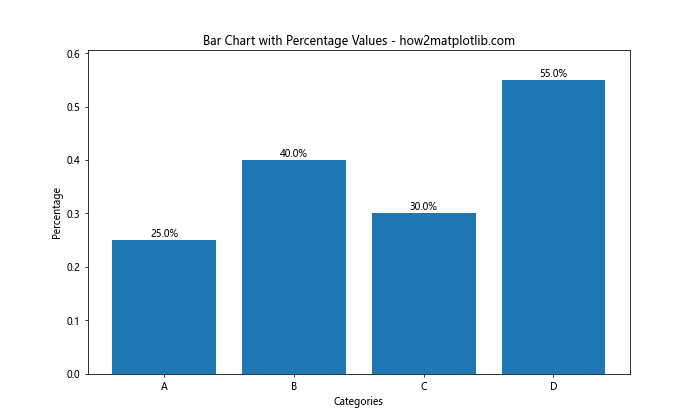
这个例子使用了 .1% 格式化字符串来将数值转换为百分比形式。
7.2 显示千位分隔符
对于大数值,使用千位分隔符可以提高可读性:
import matplotlib.pyplot as plt
import numpy as np

categories = ['A', 'B', 'C', 'D']
values = [1234567, 2345678, 3456789, 4567890]

plt.figure(figsize=(10, 6))
bars = plt.bar(categories, values)

for bar in bars:
    height = bar.get_height()
    plt.text(bar.get_x() + bar.get_width()/2., height,
             f'{height:,}',
             ha='center', va='bottom')

plt.title('Bar Chart with Formatted Large Numbers - how2matplotlib.com')
plt.xlabel('Categories')
plt.ylabel('Values')
plt.ylim(0, max(values) * 1.1)  # 为标签留出空间
plt.show()
Output:
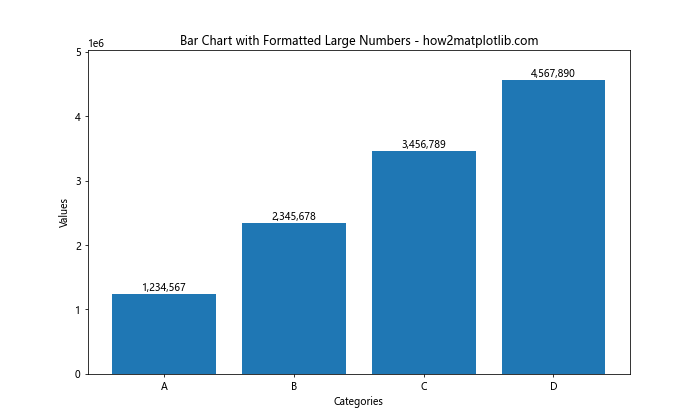
这个例子使用了 :, 格式化字符串来添加千位分隔符。
8. 动态调整标签位置
当柱子高度差异很大时,固定的标签位置可能不太合适。我们可以根据柱子高度动态调整标签位置。
8.1 根据柱子高度调整标签位置
import matplotlib.pyplot as plt
import numpy as np

categories = ['A', 'B', 'C', 'D', 'E']
values = [10, 55, 80, 32, 40]

plt.figure(figsize=(10, 6))
bars = plt.bar(categories, values)

for bar in bars:
    height = bar.get_height()
    if height < 30:
        va = 'bottom'
        y = height
    else:
        va = 'top'
        y = height - 5

    plt.text(bar.get_x() + bar.get_width()/2., y,
             f'{height}',
             ha='center', va=va)

plt.title('Bar Chart with Dynamic Label Positioning - how2matplotlib.com')
plt.xlabel('Categories')
plt.ylabel('Values')
plt.ylim(0, max(values) * 1.1)
plt.show()
Output:
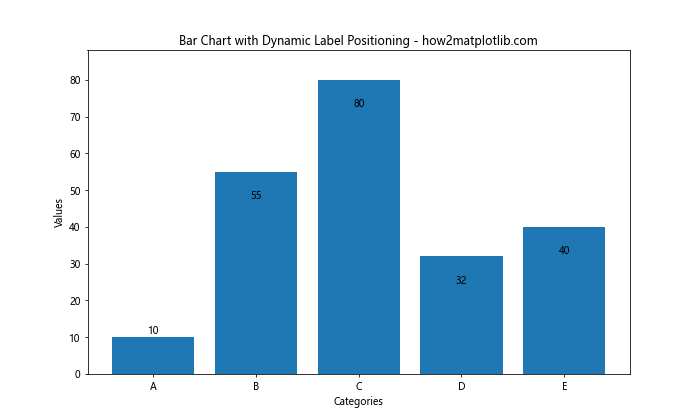
这个例子根据柱子的高度来决定标签是放在柱子内部还是顶部。
9. 使用不同颜色突出显示特定数值
我们可以使用不同的颜色来突出显示某些特定的数值,以引起观众的注意。
9.1 根据数值大小使用不同颜色
import matplotlib.pyplot as plt
import numpy as np

categories = ['A', 'B', 'C', 'D', 'E']
values = [30, 55, 80, 40, 60]

plt.figure(figsize=(10, 6))
bars = plt.bar(categories, values)

for bar in bars:
    height = bar.get_height()
    color = 'red' if height == max(values) else 'black'
    plt.text(bar.get_x() + bar.get_width()/2., height,
             f'{height}',
             ha='center', va='bottom',
             color=color, fontweight='bold' if color == 'red' else 'normal')

plt.title('Bar Chart with Highlighted Maximum Value - how2matplotlib.com')
plt.xlabel('Categories')
plt.ylabel('Values')
plt.show()
Output:
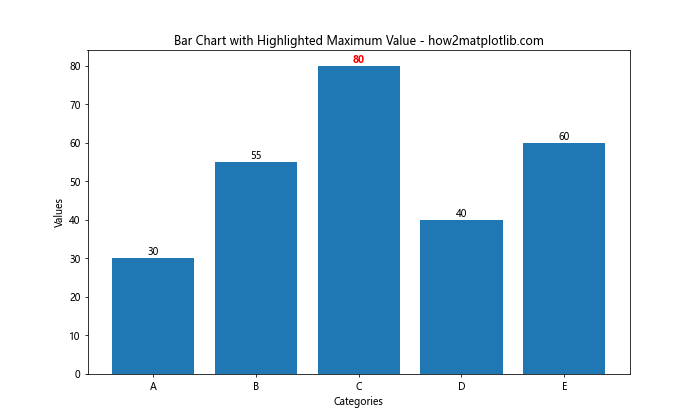
这个例子将最大值的标签颜色设置为红色并加粗,以突出显示。
10. 在3D柱状图中显示数值
Matplotlib也支持创建3D柱状图,我们同样可以在其中显示数值。
10.1 基本3D柱状图with数值
import matplotlib.pyplot as plt
import numpy as np
from mpl_toolkits.mplot3d import Axes3D

fig = plt.figure(figsize=(12, 8))
ax = fig.add_subplot(111, projection='3d')

x = ['A', 'B', 'C', 'D']
y = [1, 2, 3, 4]
z = np.zeros(4)
dx = dy = 0.8
dz = [30, 50, 60, 80]

colors = plt.cm.viridis(np.linspace(0, 1, len(x)))

bars = ax.bar3d(x, y, z, dx, dy, dz, color=colors)

for i, (xi, yi, zi, dzi) in enumerate(zip(x, y, z, dz)):
    ax.text(xi, yi, zi + dzi, f'{dzi}', ha='center', va='bottom')

ax.set_title('3D Bar Chart with Values - how2matplotlib.com')
ax.set_xlabel('X axis')
ax.set_ylabel('Y axis')
ax.set_zlabel('Z axis')

plt.tight_layout()
plt.show()
这个例子创建了一个基本的3D柱状图,并在每个柱子顶部显示了对应的数值。
结论
在本文中,我们详细探讨了如何使用Matplotlib在柱状图中显示每个柱子的具体数值。我们涵盖了从基本的数值显示到高级的格式化和布局技巧,包括处理负值、大量数据、分组柱状图、水平柱状图,以及3D柱状图等多种情况。通过这些技巧,你可以创建更加信息丰富、直观的数据可视化图表。
记住,在实际应用中,选择合适的显示方式取决于你的数据特征和目标受众。有时,简单清晰可能比复杂精美更有效。始终考虑你的图表的主要目的,并据此选择最合适的数值显示方式。
最后,Matplotlib提供了极大的灵活性,允许你进一步自定义和优化你的图表。随着你对Matplotlib的深入了解,你将能够创建出更加专业和吸引人的数据可视化作品。继续实践和探索,你会发现更多有趣的方式来展示你的数据!
 极客教程
极客教程