Matplotlib图例中如何调整项目顺序:全面指南
参考:How to Change Order of Items in Matplotlib Legend
Matplotlib是Python中最流行的数据可视化库之一,它提供了强大的绘图功能。在数据可视化中,图例(Legend)是一个非常重要的元素,它帮助读者理解图表中不同数据系列的含义。有时候,我们需要调整图例中项目的顺序,以便更好地展示数据或者使图表更加易读。本文将详细介绍如何在Matplotlib中改变图例项目的顺序,并提供多个实用的示例代码。
1. 图例的基本概念
在深入探讨如何调整图例顺序之前,我们先来了解一下Matplotlib中图例的基本概念。
图例是一个用于解释图表中各个元素含义的小框,通常包含了不同数据系列的标签和对应的视觉表示(如颜色、线型等)。在Matplotlib中,我们可以使用plt.legend()或ax.legend()方法来添加图例。
下面是一个简单的示例,展示了如何创建一个包含图例的基本图表:
import matplotlib.pyplot as plt

# 创建数据
x = range(5)
y1 = [1, 3, 2, 4, 3]
y2 = [2, 4, 3, 5, 4]

# 绘制图表
plt.plot(x, y1, label='Series 1 - how2matplotlib.com')
plt.plot(x, y2, label='Series 2 - how2matplotlib.com')

# 添加图例
plt.legend()

plt.title('Basic Plot with Legend')
plt.xlabel('X-axis')
plt.ylabel('Y-axis')
plt.show()
Output:
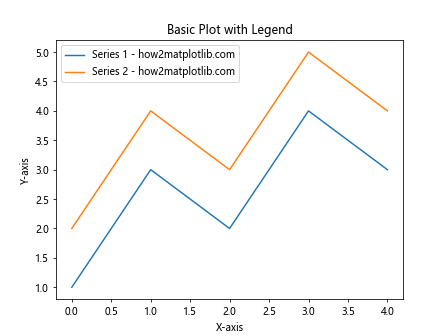
在这个示例中,我们创建了两个数据系列,并为每个系列设置了标签。通过调用plt.legend(),Matplotlib会自动创建一个包含这两个标签的图例。
2. 使用handles和labels参数调整顺序
调整图例顺序的最常用方法是使用legend()函数的handles和labels参数。这种方法允许我们明确指定图例项目的顺序。
以下是一个示例,展示如何使用这种方法:
import matplotlib.pyplot as plt

# 创建数据
x = range(5)
y1 = [1, 3, 2, 4, 3]
y2 = [2, 4, 3, 5, 4]
y3 = [3, 5, 4, 6, 5]

# 绘制图表
line1, = plt.plot(x, y1, label='Series 1 - how2matplotlib.com')
line2, = plt.plot(x, y2, label='Series 2 - how2matplotlib.com')
line3, = plt.plot(x, y3, label='Series 3 - how2matplotlib.com')

# 调整图例顺序
handles = [line3, line1, line2]
labels = ['Series 3 - how2matplotlib.com', 'Series 1 - how2matplotlib.com', 'Series 2 - how2matplotlib.com']
plt.legend(handles=handles, labels=labels)

plt.title('Plot with Reordered Legend')
plt.xlabel('X-axis')
plt.ylabel('Y-axis')
plt.show()
Output:
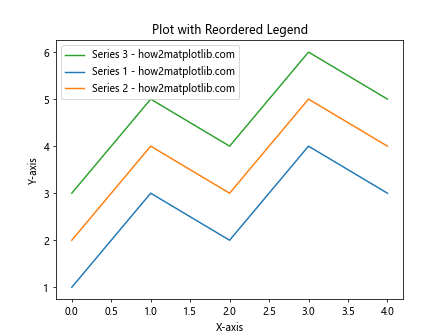
在这个示例中,我们首先创建了三个数据系列。然后,我们使用handles和labels参数来指定图例项目的新顺序。handles是一个包含图表元素(如线条)的列表,labels是对应的标签列表。通过调整这两个列表中元素的顺序,我们可以自由地改变图例中项目的顺序。
3. 使用order参数调整顺序
从Matplotlib 3.4.0版本开始,legend()函数引入了一个新的order参数,它提供了一种更简单的方法来调整图例顺序。
下面是使用order参数的示例:
import matplotlib.pyplot as plt

# 创建数据
x = range(5)
y1 = [1, 3, 2, 4, 3]
y2 = [2, 4, 3, 5, 4]
y3 = [3, 5, 4, 6, 5]

# 绘制图表
plt.plot(x, y1, label='Series 1 - how2matplotlib.com')
plt.plot(x, y2, label='Series 2 - how2matplotlib.com')
plt.plot(x, y3, label='Series 3 - how2matplotlib.com')

# 使用order参数调整图例顺序
plt.legend(order=[2, 0, 1])

plt.title('Plot with Legend Order Parameter')
plt.xlabel('X-axis')
plt.ylabel('Y-axis')
plt.show()
在这个示例中,order=[2, 0, 1]指定了图例项目的新顺序。数字表示原始顺序中的索引,所以这个设置会将第三个项目(索引2)放在第一位,原始的第一个项目(索引0)放在第二位,原始的第二个项目(索引1)放在最后。
4. 反转图例顺序
有时候,我们可能只是想简单地反转图例的顺序。这可以通过使用reversed()函数来实现。
以下是一个反转图例顺序的示例:
import matplotlib.pyplot as plt

# 创建数据
x = range(5)
y1 = [1, 3, 2, 4, 3]
y2 = [2, 4, 3, 5, 4]
y3 = [3, 5, 4, 6, 5]

# 绘制图表
lines = plt.plot(x, y1, 'r', x, y2, 'g', x, y3, 'b')
labels = ['Series 1 - how2matplotlib.com', 'Series 2 - how2matplotlib.com', 'Series 3 - how2matplotlib.com']

# 反转图例顺序
plt.legend(reversed(lines), reversed(labels))

plt.title('Plot with Reversed Legend Order')
plt.xlabel('X-axis')
plt.ylabel('Y-axis')
plt.show()
Output:
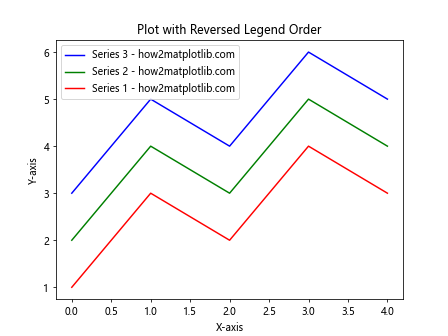
在这个示例中,我们使用reversed()函数来反转lines和labels列表的顺序。这样,图例中的项目就会以相反的顺序显示。
5. 使用字典排序图例
如果你的图例标签是基于某些数值的,你可能想要根据这些数值来排序图例。这可以通过使用字典和排序函数来实现。
下面是一个使用字典排序图例的示例:
import matplotlib.pyplot as plt

# 创建数据
x = range(5)
data = {
    'Series A - how2matplotlib.com': [1, 3, 2, 4, 3],
    'Series B - how2matplotlib.com': [2, 4, 3, 5, 4],
    'Series C - how2matplotlib.com': [3, 5, 4, 6, 5]
}

# 绘制图表
for label, values in data.items():
    plt.plot(x, values, label=label)

# 根据最后一个数据点的值排序图例
sorted_labels = sorted(data.keys(), key=lambda k: data[k][-1], reverse=True)
handles, labels = plt.gca().get_legend_handles_labels()
order = [labels.index(label) for label in sorted_labels]
plt.legend([handles[idx] for idx in order], [labels[idx] for idx in order])

plt.title('Plot with Legend Sorted by Last Data Point')
plt.xlabel('X-axis')
plt.ylabel('Y-axis')
plt.show()
Output:
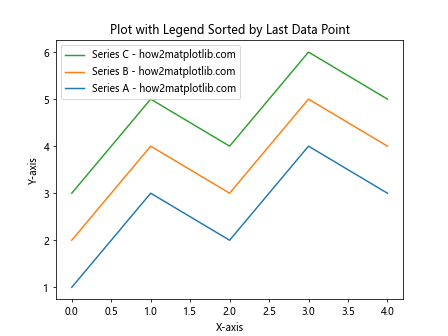
在这个示例中,我们首先创建了一个包含数据的字典。然后,我们根据每个系列最后一个数据点的值对图例进行排序。这种方法特别适用于当你想根据某个特定标准(如最终值、平均值等)来排序图例时。
6. 自定义图例顺序函数
有时候,你可能需要更复杂的逻辑来决定图例的顺序。在这种情况下,你可以创建一个自定义函数来确定顺序。
以下是一个使用自定义函数排序图例的示例:
import matplotlib.pyplot as plt
import numpy as np

def custom_sort(label):
    # 自定义排序逻辑
    if 'Series A' in label:
        return 2
    elif 'Series B' in label:
        return 0
    else:
        return 1

# 创建数据
x = np.linspace(0, 10, 100)
y1 = np.sin(x)
y2 = np.cos(x)
y3 = np.tan(x)

# 绘制图表
plt.plot(x, y1, label='Series A - how2matplotlib.com')
plt.plot(x, y2, label='Series B - how2matplotlib.com')
plt.plot(x, y3, label='Series C - how2matplotlib.com')

# 获取图例句柄和标签
handles, labels = plt.gca().get_legend_handles_labels()

# 使用自定义函数排序
sorted_pairs = sorted(zip(handles, labels), key=lambda t: custom_sort(t[1]))
handles, labels = zip(*sorted_pairs)

plt.legend(handles, labels)

plt.title('Plot with Custom Legend Order')
plt.xlabel('X-axis')
plt.ylabel('Y-axis')
plt.show()
Output:
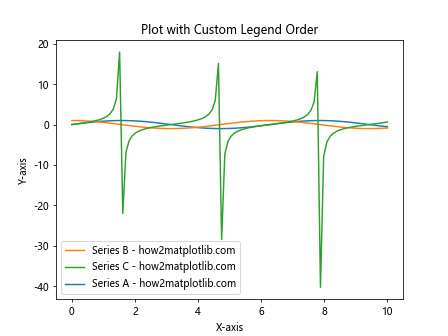
在这个示例中,我们定义了一个custom_sort函数,它根据标签中的文本返回一个排序值。然后,我们使用这个函数来排序图例项目。这种方法提供了最大的灵活性,允许你根据任何自定义逻辑来排序图例。
7. 处理多列图例
当你的图表包含很多数据系列时,你可能想要创建一个多列的图例。在这种情况下,调整图例顺序可能会变得更加复杂。
以下是一个处理多列图例顺序的示例:
import matplotlib.pyplot as plt
import numpy as np

# 创建数据
x = np.linspace(0, 10, 100)
data = {f'Series {i} - how2matplotlib.com': np.sin(x + i) for i in range(6)}

# 绘制图表
for label, y in data.items():
    plt.plot(x, y, label=label)

# 获取图例句柄和标签
handles, labels = plt.gca().get_legend_handles_labels()

# 重新排序
new_order = [3, 1, 5, 0, 2, 4]
handles = [handles[i] for i in new_order]
labels = [labels[i] for i in new_order]

# 创建多列图例
plt.legend(handles, labels, ncol=2)

plt.title('Plot with Multi-column Legend')
plt.xlabel('X-axis')
plt.ylabel('Y-axis')
plt.show()
Output:
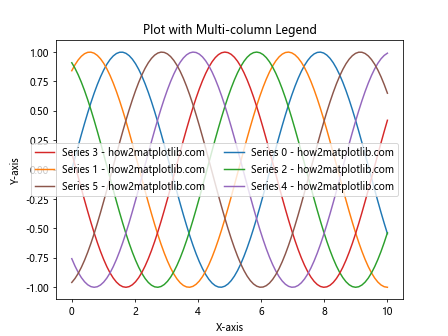
在这个示例中,我们首先创建了6个数据系列。然后,我们使用一个新的顺序列表来重新排列图例项目。最后,我们使用ncol=2参数来创建一个两列的图例。这种方法允许你在处理大量数据系列时仍然能够灵活地调整图例顺序。
8. 动态调整图例顺序
在某些情况下,你可能需要根据数据的某些特征动态地调整图例顺序。例如,你可能想要根据每个数据系列的平均值来排序图例。
以下是一个动态调整图例顺序的示例:
import matplotlib.pyplot as plt
import numpy as np

# 创建数据
x = np.linspace(0, 10, 100)
data = {
    'Series A - how2matplotlib.com': np.sin(x),
    'Series B - how2matplotlib.com': np.cos(x),
    'Series C - how2matplotlib.com': np.tan(x),
    'Series D - how2matplotlib.com': x**2,
    'Series E - how2matplotlib.com': np.log(x+1)
}

# 绘制图表
for label, y in data.items():
    plt.plot(x, y, label=label)

# 获取图例句柄和标签
handles, labels = plt.gca().get_legend_handles_labels()

# 根据每个系列的平均值排序
sorted_pairs = sorted(zip(handles, labels), key=lambda t: np.mean(data[t[1]]), reverse=True)
handles, labels = zip(*sorted_pairs)

plt.legend(handles, labels)

plt.title('Plot with Dynamically Ordered Legend')
plt.xlabel('X-axis')
plt.ylabel('Y-axis')
plt.show()
Output:
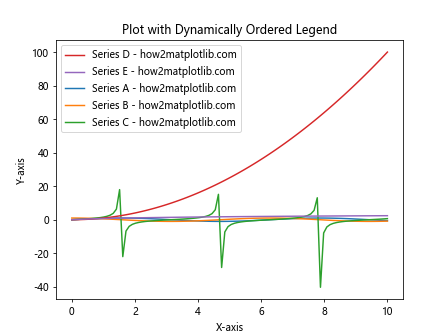
在这个示例中,我们根据每个数据系列的平均值来排序图例。这种方法特别有用,因为它允许图例顺序自动适应数据的变化。
9. 处理散点图的图例顺序
散点图是另一种常见的图表类型,它的图例顺序调整可能略有不同。以下是一个调整散点图图例顺序的示例:
import matplotlib.pyplot as plt
import numpy as np

# 创建数据
np.random.seed(0)
data = {
    'Group A - how2matplotlib.com': (np.random.rand(20), np.random.rand(20)),
    'Group B - how2matplotlib.com': (np.random.rand(20), np.random.rand(20)),
    'Group C - how2matplotlib.com': (np.random.rand(20), np.random.rand(20))
}

# 绘制散点图
for label, (x, y) in data.items():
    plt.scatter(x, y, label=label)

# 获取图例句柄和标签
handles, labels = plt.gca().get_legend_handles_labels()

# 自定定义顺序
new_order = [2, 0, 1]
handles = [handles[i] for i in new_order]
labels = [labels[i] for i in new_order]

plt.legend(handles, labels)

plt.title('Scatter Plot with Reordered Legend')
plt.xlabel('X-axis')
plt.ylabel('Y-axis')
plt.show()
Output:
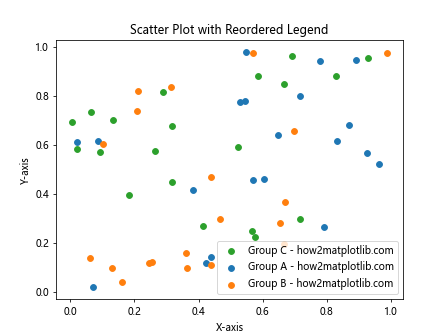
在这个散点图示例中,我们为每个组创建了随机数据点。然后,我们使用scatter()函数绘制这些点。最后,我们通过重新排列handles和labels列表来调整图例顺序。
10. 处理堆叠图的图例顺序
堆叠图是另一种常见的图表类型,其图例顺序的调整可能会影响数据的可读性。以下是一个调整堆叠图图例顺序的示例:
import matplotlib.pyplot as plt
import numpy as np

# 创建数据
categories = ['Cat A', 'Cat B', 'Cat C', 'Cat D']
values = {
    'Series 1 - how2matplotlib.com': np.random.rand(4),
    'Series 2 - how2matplotlib.com': np.random.rand(4),
    'Series 3 - how2matplotlib.com': np.random.rand(4)
}

# 绘制堆叠图
bottom = np.zeros(4)
for label, data in values.items():
    plt.bar(categories, data, bottom=bottom, label=label)
    bottom += data

# 获取图例句柄和标签
handles, labels = plt.gca().get_legend_handles_labels()

# 反转顺序
handles = handles[::-1]
labels = labels[::-1]

plt.legend(handles, labels)

plt.title('Stacked Bar Plot with Reordered Legend')
plt.xlabel('Categories')
plt.ylabel('Values')
plt.show()
Output:
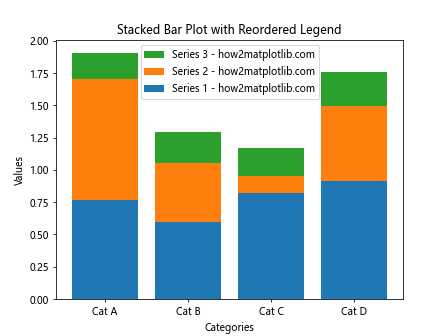
在这个堆叠图示例中,我们创建了三个数据系列,每个系列包含四个类别的数据。我们使用bar()函数来创建堆叠条形图。然后,我们通过反转handles和labels列表来调整图例顺序。这种调整对于堆叠图特别重要,因为图例顺序通常应该与堆叠顺序相匹配。
11. 使用zorder参数影响图例顺序
虽然zorder参数主要用于控制绘图元素的堆叠顺序,但它也可以间接影响图例的顺序。以下是一个使用zorder参数的示例:
import matplotlib.pyplot as plt
import numpy as np

# 创建数据
x = np.linspace(0, 10, 100)
y1 = np.sin(x)
y2 = np.cos(x)
y3 = np.tan(x)

# 绘制图表,使用zorder参数
plt.plot(x, y1, label='Sin - how2matplotlib.com', zorder=3)
plt.plot(x, y2, label='Cos - how2matplotlib.com', zorder=1)
plt.plot(x, y3, label='Tan - how2matplotlib.com', zorder=2)

# 创建图例
plt.legend()

plt.title('Plot with zorder Affecting Legend Order')
plt.xlabel('X-axis')
plt.ylabel('Y-axis')
plt.show()
Output:
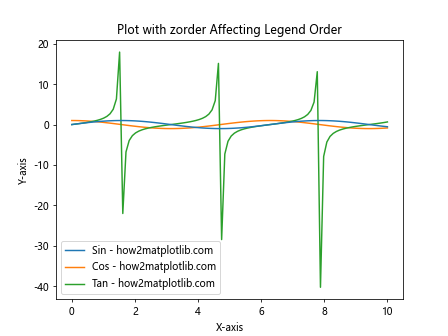
在这个示例中,我们使用zorder参数来控制线条的绘制顺序。较高的zorder值意味着该元素会被绘制在上层。虽然这不会直接改变图例的顺序,但它会影响图例中符号的绘制顺序,这可能会影响观察者对图例顺序的感知。
12. 处理多子图的图例顺序
当你的图表包含多个子图时,调整图例顺序可能会变得更加复杂。以下是一个处理多子图图例顺序的示例:
import matplotlib.pyplot as plt
import numpy as np

# 创建数据
x = np.linspace(0, 10, 100)
y1 = np.sin(x)
y2 = np.cos(x)
y3 = np.tan(x)

# 创建2x2的子图
fig, axs = plt.subplots(2, 2, figsize=(12, 10))

# 在每个子图中绘制数据
for ax in axs.flat:
    ax.plot(x, y1, label='Sin - how2matplotlib.com')
    ax.plot(x, y2, label='Cos - how2matplotlib.com')
    ax.plot(x, y3, label='Tan - how2matplotlib.com')

# 获取所有图例句柄和标签
handles, labels = axs[0, 0].get_legend_handles_labels()

# 自定义顺序
new_order = [2, 0, 1]
handles = [handles[i] for i in new_order]
labels = [labels[i] for i in new_order]

# 创建一个共享的图例
fig.legend(handles, labels, loc='center right')

plt.tight_layout()
plt.show()
Output:
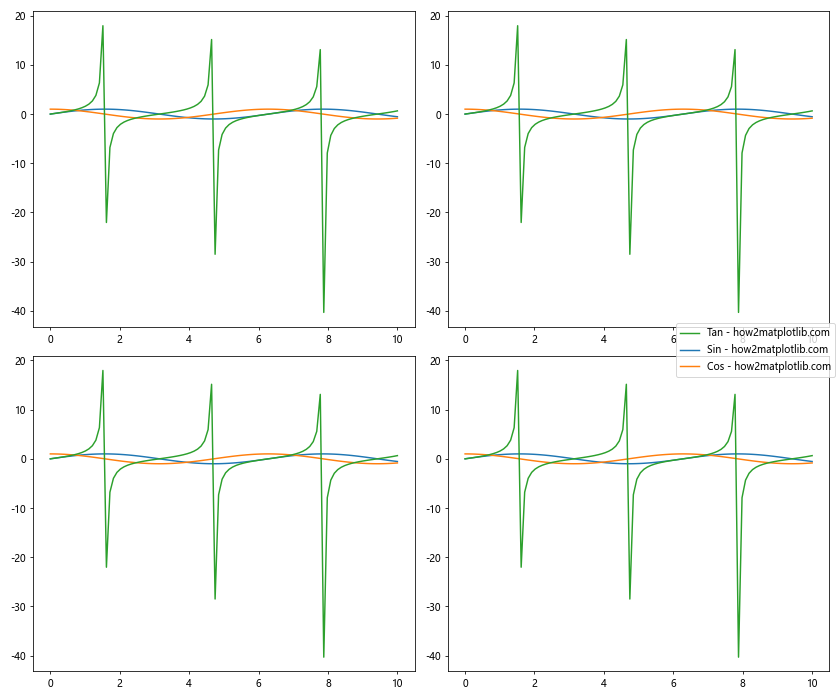
在这个示例中,我们创建了一个2×2的子图网格,并在每个子图中绘制了相同的数据。然后,我们获取第一个子图的图例句柄和标签,重新排序,并创建一个共享的图例。这种方法可以确保所有子图共享一个一致的、有序的图例。
13. 使用sorted()函数排序图例
Python的sorted()函数提供了一种灵活的方式来排序图例项目。以下是一个使用sorted()函数排序图例的示例:
import matplotlib.pyplot as plt
import numpy as np

# 创建数据
x = np.linspace(0, 10, 100)
data = {
    'Series C - how2matplotlib.com': np.sin(x),
    'Series A - how2matplotlib.com': np.cos(x),
    'Series B - how2matplotlib.com': np.tan(x)
}

# 绘制图表
for label, y in data.items():
    plt.plot(x, y, label=label)

# 获取图例句柄和标签
handles, labels = plt.gca().get_legend_handles_labels()

# 使用sorted()函数排序
sorted_pairs = sorted(zip(handles, labels), key=lambda t: t[1])
handles, labels = zip(*sorted_pairs)

plt.legend(handles, labels)

plt.title('Plot with Legend Sorted Alphabetically')
plt.xlabel('X-axis')
plt.ylabel('Y-axis')
plt.show()
Output:
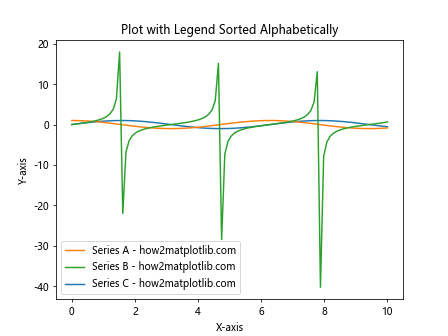
在这个示例中,我们使用sorted()函数按字母顺序排序图例项目。key参数允许我们指定排序的依据,在这里我们使用标签(t[1])作为排序依据。
14. 使用OrderedDict控制图例顺序
Python的OrderedDict可以用来精确控制图例的顺序。以下是一个使用OrderedDict的示例:
from collections import OrderedDict
import matplotlib.pyplot as plt
import numpy as np

# 创建有序字典
data = OrderedDict([
    ('Series C - how2matplotlib.com', np.sin),
    ('Series A - how2matplotlib.com', np.cos),
    ('Series B - how2matplotlib.com', np.tan)
])

# 创建数据
x = np.linspace(0, 10, 100)

# 绘制图表
for label, func in data.items():
    plt.plot(x, func(x), label=label)

plt.legend()

plt.title('Plot with Legend Order Controlled by OrderedDict')
plt.xlabel('X-axis')
plt.ylabel('Y-axis')
plt.show()
Output:
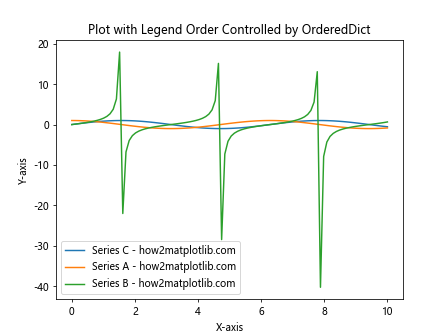
在这个示例中,我们使用OrderedDict来定义数据系列的顺序。这种方法可以确保图例的顺序与数据定义的顺序完全一致。
15. 使用bbox_to_anchor调整图例位置
虽然这不直接涉及图例顺序,但调整图例位置可以影响观察者对图例顺序的感知。以下是一个使用bbox_to_anchor调整图例位置的示例:
import matplotlib.pyplot as plt
import numpy as np

# 创建数据
x = np.linspace(0, 10, 100)
y1 = np.sin(x)
y2 = np.cos(x)
y3 = np.tan(x)

# 绘制图表
plt.plot(x, y1, label='Sin - how2matplotlib.com')
plt.plot(x, y2, label='Cos - how2matplotlib.com')
plt.plot(x, y3, label='Tan - how2matplotlib.com')

# 调整图例位置
plt.legend(bbox_to_anchor=(1.05, 1), loc='upper left')

plt.title('Plot with Adjusted Legend Position')
plt.xlabel('X-axis')
plt.ylabel('Y-axis')
plt.tight_layout()
plt.show()
Output:
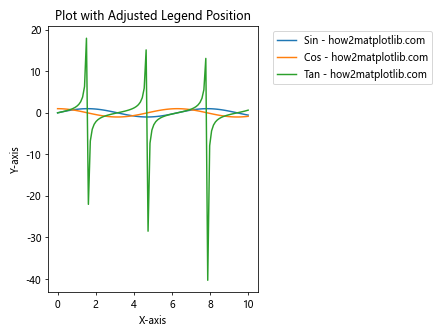
在这个示例中,我们使用bbox_to_anchor参数将图例放置在图表的右上角外部。这种方法可以帮助你在调整图例顺序的同时,也优化图例的位置。
结论
调整Matplotlib图例中项目的顺序是一项重要的技能,它可以帮助你创建更清晰、更有意义的数据可视化。本文介绍了多种方法来实现这一目标,从简单的使用handles和labels参数,到更复杂的使用自定义排序函数。我们还探讨了如何处理多列图例、散点图、堆叠图以及多子图的情况。
记住,图例顺序的选择应该基于你想要传达的信息。有时,按照数据系列的重要性排序可能是最好的选择;其他时候,按字母顺序或数值大小排序可能更有意义。无论你选择哪种方法,确保图例顺序能够增强而不是混淆你的数据故事。
通过掌握这些技术,你将能够更好地控制你的数据可视化,创建更专业、更有洞察力的图表。继续实践这些方法,你会发现Matplotlib提供了极大的灵活性,可以满足几乎所有的数据可视化需求。
 极客教程
极客教程