Matplotlib中如何更改线条颜色:全面指南
参考:How to Change Line Color in Matplotlib
Matplotlib是Python中最流行的数据可视化库之一,它提供了丰富的绘图功能和高度的可定制性。在使用Matplotlib绘制线图时,更改线条颜色是一个常见的需求,可以帮助我们区分不同的数据系列,突出重要信息,或者simply美化图表。本文将全面介绍如何在Matplotlib中更改线条颜色,包括基本方法、高级技巧以及常见问题的解决方案。
1. 基本颜色设置
在Matplotlib中,最简单的更改线条颜色的方法是在绘图函数中使用color参数。Matplotlib支持多种颜色指定方式,包括颜色名称、RGB值、十六进制代码等。
1.1 使用颜色名称
Matplotlib内置了许多常用颜色的名称,如’red’、’blue’、’green’等。以下是一个使用颜色名称设置线条颜色的示例:
import matplotlib.pyplot as plt

x = [1, 2, 3, 4, 5]
y = [2, 4, 6, 8, 10]

plt.plot(x, y, color='red', label='how2matplotlib.com')
plt.title('Red Line Example')
plt.xlabel('X-axis')
plt.ylabel('Y-axis')
plt.legend()
plt.show()
Output:
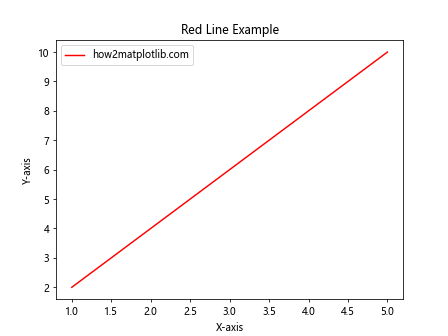
在这个例子中,我们使用color='red'将线条颜色设置为红色。Matplotlib支持多种颜色名称,包括基本颜色和一些更具体的色调。
1.2 使用RGB值
对于更精确的颜色控制,我们可以使用RGB(红绿蓝)值来指定颜色。RGB值是一个包含三个0到1之间的浮点数的元组,分别表示红、绿、蓝三种颜色的强度。
import matplotlib.pyplot as plt

x = [1, 2, 3, 4, 5]
y = [2, 4, 6, 8, 10]

plt.plot(x, y, color=(0.1, 0.5, 0.8), label='how2matplotlib.com')
plt.title('RGB Color Example')
plt.xlabel('X-axis')
plt.ylabel('Y-axis')
plt.legend()
plt.show()
Output:
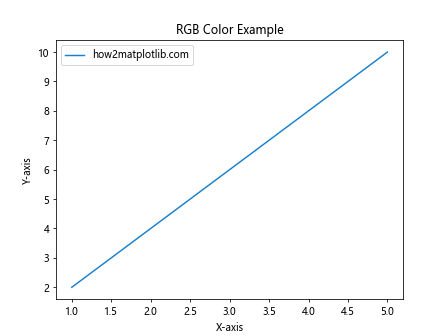
在这个例子中,我们使用color=(0.1, 0.5, 0.8)设置了一个偏蓝色的线条。通过调整RGB值,我们可以创建几乎任何颜色。
1.3 使用十六进制代码
十六进制颜色代码是另一种常用的颜色指定方式,特别是在Web开发中。Matplotlib也支持这种格式。
import matplotlib.pyplot as plt

x = [1, 2, 3, 4, 5]
y = [2, 4, 6, 8, 10]

plt.plot(x, y, color='#FF5733', label='how2matplotlib.com')
plt.title('Hex Color Example')
plt.xlabel('X-axis')
plt.ylabel('Y-axis')
plt.legend()
plt.show()
Output:
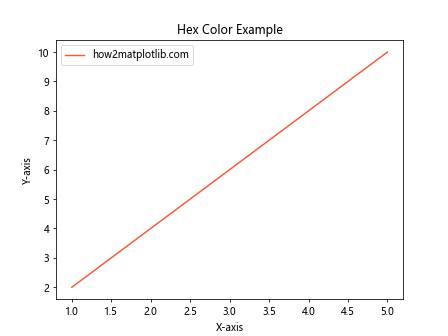
这里我们使用color='#FF5733'设置了一个橙红色的线条。十六进制代码提供了精确的颜色控制,同时也方便与其他设计工具的颜色规范保持一致。
2. 高级颜色设置技巧
除了基本的颜色设置方法,Matplotlib还提供了一些高级技巧,允许我们更灵活地控制线条颜色。
2.1 使用颜色映射(Colormap)
颜色映射是一种将数值范围映射到颜色范围的方法,特别适用于表示连续变化的数据。
import matplotlib.pyplot as plt
import numpy as np

x = np.linspace(0, 10, 100)
y = np.sin(x)

plt.scatter(x, y, c=y, cmap='viridis', label='how2matplotlib.com')
plt.colorbar(label='Value')
plt.title('Colormap Example')
plt.xlabel('X-axis')
plt.ylabel('Y-axis')
plt.legend()
plt.show()
Output:
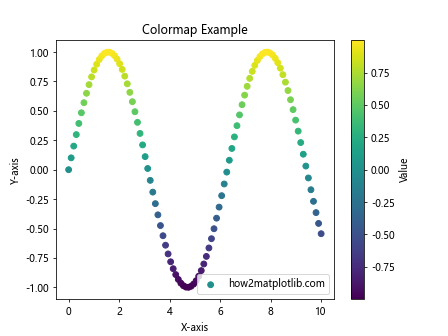
在这个例子中,我们使用scatter函数绘制了一系列点,并使用viridis颜色映射根据y值为每个点着色。colorbar函数添加了一个颜色条来解释颜色与值的对应关系。
2.2 循环颜色
当绘制多条线时,我们可能希望自动为每条线分配不同的颜色。Matplotlib提供了一个内置的颜色循环机制。
import matplotlib.pyplot as plt
import numpy as np

x = np.linspace(0, 10, 100)

for i in range(5):
    plt.plot(x, np.sin(x + i), label=f'Line {i+1} - how2matplotlib.com')

plt.title('Cycled Colors Example')
plt.xlabel('X-axis')
plt.ylabel('Y-axis')
plt.legend()
plt.show()
Output:
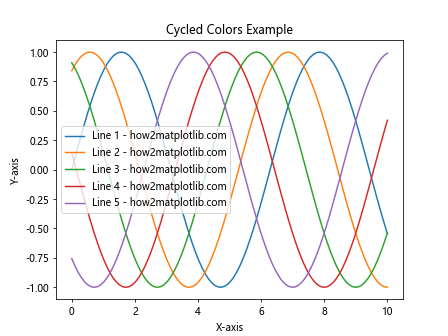
在这个例子中,我们绘制了5条正弦曲线。Matplotlib自动为每条线分配了不同的颜色,无需我们手动指定。
2.3 自定义颜色循环
如果默认的颜色循环不满足需求,我们可以自定义颜色循环。
import matplotlib.pyplot as plt
import numpy as np

x = np.linspace(0, 10, 100)
custom_colors = ['#FF9999', '#66B2FF', '#99FF99', '#FFCC99', '#FF99CC']

for i, color in enumerate(custom_colors):
    plt.plot(x, np.sin(x + i), color=color, label=f'Line {i+1} - how2matplotlib.com')

plt.title('Custom Color Cycle Example')
plt.xlabel('X-axis')
plt.ylabel('Y-axis')
plt.legend()
plt.show()
Output:
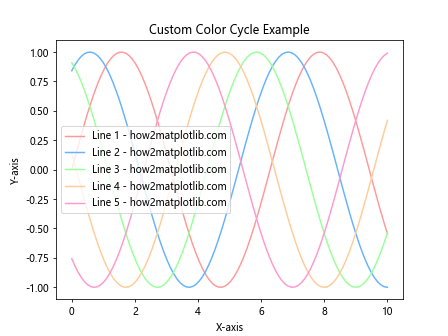
在这个例子中,我们定义了一个自定义的颜色列表,并在绘制每条线时循环使用这些颜色。
3. 动态颜色变化
有时我们可能需要根据某些条件动态改变线条颜色,比如根据数据值或其他变量。
3.1 根据数据值改变颜色
我们可以使用条件语句来根据数据值动态设置颜色。
import matplotlib.pyplot as plt
import numpy as np

x = np.linspace(0, 10, 100)
y = np.sin(x)

colors = ['red' if yi > 0 else 'blue' for yi in y]

plt.scatter(x, y, c=colors, label='how2matplotlib.com')
plt.title('Dynamic Color Change Example')
plt.xlabel('X-axis')
plt.ylabel('Y-axis')
plt.legend()
plt.show()
Output:
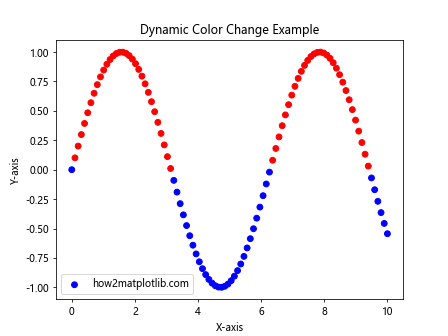
在这个例子中,我们根据y值的正负来决定每个点的颜色:正值为红色,负值为蓝色。
3.2 使用渐变颜色
我们可以创建一个颜色渐变效果,使线条颜色沿着某个维度平滑变化。
import matplotlib.pyplot as plt
import numpy as np

x = np.linspace(0, 10, 100)
y = np.sin(x)

plt.scatter(x, y, c=x, cmap='cool', label='how2matplotlib.com')
plt.colorbar(label='X value')
plt.title('Gradient Color Example')
plt.xlabel('X-axis')
plt.ylabel('Y-axis')
plt.legend()
plt.show()
Output:
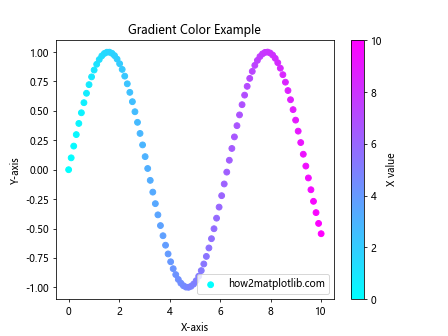
在这个例子中,我们使用x值来决定每个点的颜色,创建了一个从左到右的颜色渐变效果。
4. 透明度设置
除了颜色本身,我们还可以调整线条的透明度,这在绘制多层数据或强调某些数据时特别有用。
4.1 使用alpha参数
alpha参数控制线条的透明度,取值范围从0(完全透明)到1(完全不透明)。
import matplotlib.pyplot as plt
import numpy as np

x = np.linspace(0, 10, 100)

plt.plot(x, np.sin(x), color='red', alpha=0.5, label='Sin - how2matplotlib.com')
plt.plot(x, np.cos(x), color='blue', alpha=0.5, label='Cos - how2matplotlib.com')

plt.title('Transparency Example')
plt.xlabel('X-axis')
plt.ylabel('Y-axis')
plt.legend()
plt.show()
Output:
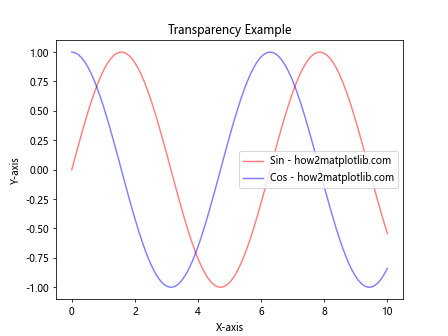
在这个例子中,我们绘制了正弦和余弦曲线,并将它们的透明度设置为0.5,使两条线都可以清晰可见。
4.2 结合颜色和透明度
我们可以在RGB或RGBA颜色表示中直接包含透明度信息。
import matplotlib.pyplot as plt
import numpy as np

x = np.linspace(0, 10, 100)

plt.plot(x, np.sin(x), color=(1, 0, 0, 0.5), label='Sin - how2matplotlib.com')
plt.plot(x, np.cos(x), color=(0, 0, 1, 0.5), label='Cos - how2matplotlib.com')

plt.title('RGBA Color Example')
plt.xlabel('X-axis')
plt.ylabel('Y-axis')
plt.legend()
plt.show()
Output:
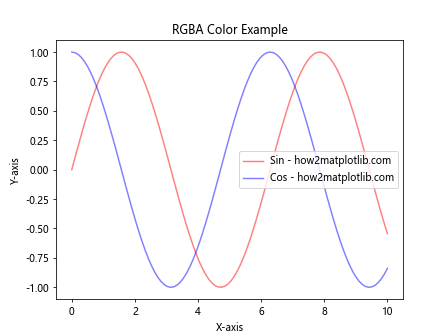
在这个例子中,我们使用RGBA值来同时指定颜色和透明度。(1, 0, 0, 0.5)表示半透明的红色,(0, 0, 1, 0.5)表示半透明的蓝色。
5. 特殊效果
Matplotlib还提供了一些特殊的颜色效果,可以让我们的图表更加生动和富有表现力。
5.1 使用线性渐变
我们可以创建一个线性渐变效果,使线条颜色沿着其长度变化。
import matplotlib.pyplot as plt
import numpy as np
from matplotlib.colors import LinearSegmentedColormap

x = np.linspace(0, 10, 100)
y = np.sin(x)

colors = [(0, "blue"), (0.5, "green"), (1, "red")]
n_bins = 100
cmap = LinearSegmentedColormap.from_list("custom", colors, N=n_bins)

points = np.array([x, y]).T.reshape(-1, 1, 2)
segments = np.concatenate([points[:-1], points[1:]], axis=1)

lc = plt.LineCollection(segments, cmap=cmap, norm=plt.Normalize(0, 10))
lc.set_array(x)
lc.set_linewidth(2)

plt.gca().add_collection(lc)
plt.colorbar(lc)
plt.xlim(x.min(), x.max())
plt.ylim(-1.1, 1.1)
plt.title('Linear Gradient Example - how2matplotlib.com')
plt.show()
这个例子创建了一个从蓝色到绿色再到红色的线性渐变效果,颜色随x值变化。
5.2 使用径向渐变
我们还可以创建径向渐变效果,使颜色从中心向外变化。
import matplotlib.pyplot as plt
import numpy as np
from matplotlib.colors import LinearSegmentedColormap

theta = np.linspace(0, 2*np.pi, 100)
r = np.linspace(0, 1, 100)
T, R = np.meshgrid(theta, r)
X, Y = R*np.cos(T), R*np.sin(T)

colors = [(0, "white"), (1, "red")]
cmap = LinearSegmentedColormap.from_list("custom", colors, N=256)

plt.pcolormesh(X, Y, R, cmap=cmap, shading='auto')
plt.title('Radial Gradient Example - how2matplotlib.com')
plt.axis('equal')
plt.colorbar(label='Radius')
plt.show()
Output:
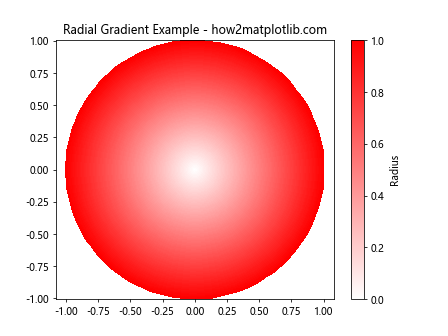
这个例子创建了一个从中心白色到边缘红色的径向渐变效果。
6. 颜色在多子图中的应用
当我们需要在一个图形中绘制多个子图时,保持颜色的一致性和可读性变得尤为重要。
6.1 在子图中保持颜色一致性
import matplotlib.pyplot as plt
import numpy as np

x = np.linspace(0, 10, 100)
y1 = np.sin(x)
y2 = np.cos(x)

fig, (ax1, ax2) = plt.subplots(1, 2, figsize=(12, 5))

ax1.plot(x, y1, color='red', label='Sin - how2matplotlib.com')
ax1.set_title('Sine Wave')
ax1.legend()

ax2.plot(x, y2, color='blue', label='Cos - how2matplotlib.com')
ax2.set_title('Cosine Wave')
ax2.legend()

plt.tight_layout()
plt.show()
Output:
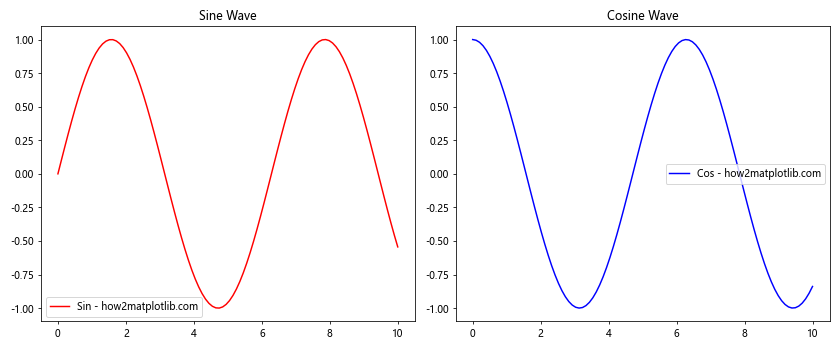
在这个例子中,我们创建了两个子图,分别绘制正弦和余弦函数,并为它们使用不同的颜色。这种方法可以帮助读者在不同的子图中识别相同的数据系列。
6.2 在子图中使用颜色映射
我们可以在多个子图中使用相同的颜色映射,以保持视觉上的一致性。
import matplotlib.pyplot as plt
import numpy as np

x = np.linspace(0, 10, 100)
y1 = np.sin(x)
y2 = np.cos(x)

fig, (ax1, ax2) = plt.subplots(1, 2, figsize=(12, 5))

scatter1 = ax1.scatter(x, y1, c=y1, cmap='viridis', label='Sin - how2matplotlib.com')
ax1.set_title('Sine Wave')
ax1.legend()

scatter2 = ax2.scatter(x, y2, c=y2, cmap='viridis', label='Cos - how2matplotlib.com')
ax2.set_title('Cosine Wave')
ax2.legend()

fig.colorbar(scatter1, ax=(ax1, ax2), label='Value')
plt.tight_layout()
plt.show()
Output:
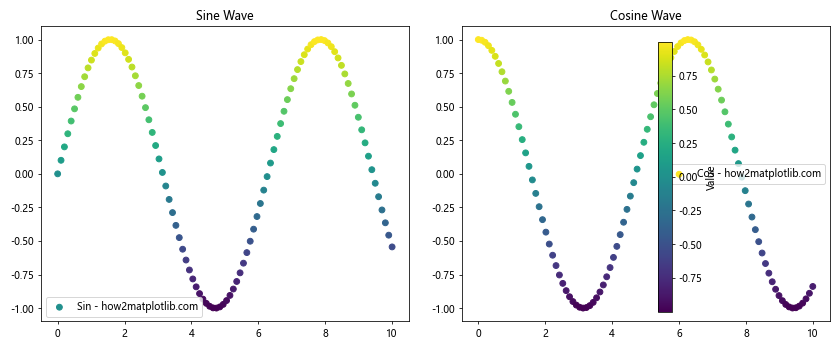
在这个例子中,我们在两个子图中使用了相同的’viridis’颜色映射,并添加了一个共享的颜色条。这种方法可以帮助读者在不同的子图中比较数据值。
7. 处理大量数据时的颜色设置
当处理大量数据点时,合理的颜色设置可以帮助我们更好地展示数据的分布和趋势。
7.1 使用透明度处理密集数据
import matplotlib.pyplot as plt
import numpy as np

np.random.seed(0)
x = np.random.randn(10000)
y = np.random.randn(10000)

plt.scatter(x, y, alpha=0.1, color='blue', label='how2matplotlib.com')
plt.title('Density Plot with Transparency')
plt.xlabel('X-axis')
plt.ylabel('Y-axis')
plt.legend()
plt.show()
Output:
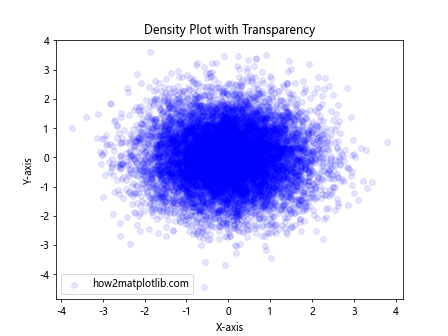
在这个例子中,我们绘制了10000个随机点,并将透明度设置为0.1。这样可以清晰地显示数据的密度分布,高密度区域会显得更深。
7.2 使用热力图表示密度
对于非常大的数据集,我们可以使用热力图来表示数据密度。
import matplotlib.pyplot as plt
import numpy as np

np.random.seed(0)
x = np.random.randn(100000)
y = np.random.randn(100000)

plt.hist2d(x, y, bins=50, cmap='hot')
plt.colorbar(label='Count')
plt.title('2D Histogram - how2matplotlib.com')
plt.xlabel('X-axis')
plt.ylabel('Y-axis')
plt.show()
Output:

这个例子创建了一个2D直方图,使用热力图颜色方案来表示每个bin中的点的数量。这种方法对于可视化大量数据点的分布非常有效。
8. 颜色和数据类型的关系
不同类型的数据可能需要不同的颜色策略。了解如何为不同类型的数据选择合适的颜色方案是很重要的。
8.1 分类数据的颜色设置
对于分类数据,我们通常使用离散的颜色。
import matplotlib.pyplot as plt
import numpy as np

categories = ['A', 'B', 'C', 'D', 'E']
values = [23, 45, 56, 78, 32]
colors = ['red', 'green', 'blue', 'yellow', 'purple']

plt.bar(categories, values, color=colors)
plt.title('Bar Chart for Categorical Data - how2matplotlib.com')
plt.xlabel('Categories')
plt.ylabel('Values')
plt.show()
Output:

在这个例子中,我们为每个类别使用了不同的颜色,使得各个类别之间容易区分。
8.2 连续数据的颜色设置
对于连续数据,我们通常使用渐变色或颜色映射。
import matplotlib.pyplot as plt
import numpy as np

x = np.linspace(0, 10, 100)
y = np.sin(x)

plt.scatter(x, y, c=y, cmap='coolwarm', label='how2matplotlib.com')
plt.colorbar(label='Value')
plt.title('Scatter Plot for Continuous Data')
plt.xlabel('X-axis')
plt.ylabel('Y-axis')
plt.legend()
plt.show()
Output:

这个例子使用了’coolwarm’颜色映射来表示y值的变化,蓝色表示较低的值,红色表示较高的值。
9. 颜色和可访问性
在选择颜色时,考虑可访问性是很重要的。我们应该选择对色盲友好的颜色方案,并确保足够的对比度。
9.1 使用色盲友好的颜色方案
import matplotlib.pyplot as plt
import numpy as np

x = np.linspace(0, 10, 100)

plt.plot(x, np.sin(x), color='#0072B2', label='Sin - how2matplotlib.com')
plt.plot(x, np.cos(x), color='#D55E00', label='Cos - how2matplotlib.com')
plt.plot(x, np.tan(x), color='#009E73', label='Tan - how2matplotlib.com')

plt.title('Colorblind-friendly Plot')
plt.xlabel('X-axis')
plt.ylabel('Y-axis')
plt.legend()
plt.ylim(-2, 2)
plt.show()
Output:
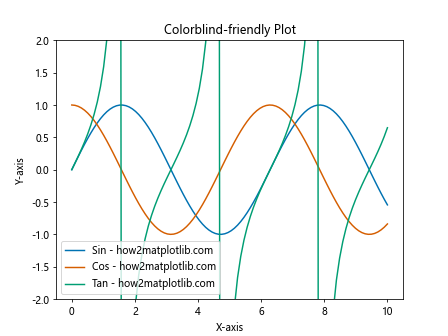
这个例子使用了一组色盲友好的颜色(蓝色、橙红色和绿色),这些颜色即使对于色盲观众也容易区分。
9.2 确保足够的对比度
import matplotlib.pyplot as plt
import numpy as np

x = np.linspace(0, 10, 100)

plt.figure(facecolor='black')
plt.plot(x, np.sin(x), color='white', label='Sin - how2matplotlib.com')
plt.plot(x, np.cos(x), color='yellow', label='Cos - how2matplotlib.com')

plt.title('High Contrast Plot', color='white')
plt.xlabel('X-axis', color='white')
plt.ylabel('Y-axis', color='white')
plt.legend()
plt.tick_params(colors='white')
plt.show()
Output:
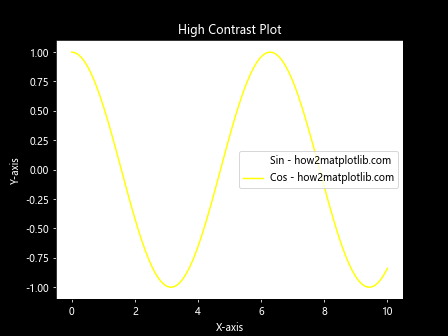
这个例子使用了黑色背景和亮色线条,确保了高对比度,使图表更容易阅读。
10. 保存和导出带有自定义颜色的图表
最后,了解如何正确保存和导出我们精心设计的彩色图表也很重要。
10.1 保存为PNG格式
import matplotlib.pyplot as plt
import numpy as np

x = np.linspace(0, 10, 100)
y = np.sin(x)

plt.plot(x, y, color='red', label='how2matplotlib.com')
plt.title('Sine Wave')
plt.xlabel('X-axis')
plt.ylabel('Y-axis')
plt.legend()

plt.savefig('sine_wave.png', dpi=300, bbox_inches='tight')
plt.show()
Output:
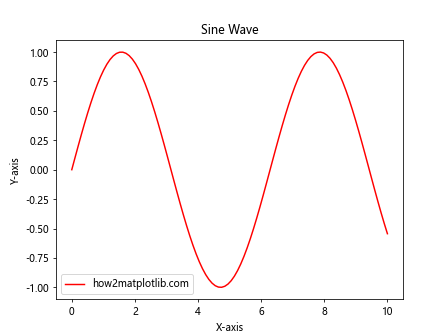
这个例子将图表保存为高质量的PNG文件。dpi=300设置了较高的分辨率,bbox_inches='tight'确保图表的所有部分都被包含在保存的文件中。
10.2 保存为矢量格式
import matplotlib.pyplot as plt
import numpy as np

x = np.linspace(0, 10, 100)
y = np.sin(x)

plt.plot(x, y, color='blue', label='how2matplotlib.com')
plt.title('Sine Wave')
plt.xlabel('X-axis')
plt.ylabel('Y-axis')
plt.legend()

plt.savefig('sine_wave.svg', format='svg', bbox_inches='tight')
plt.show()
Output:
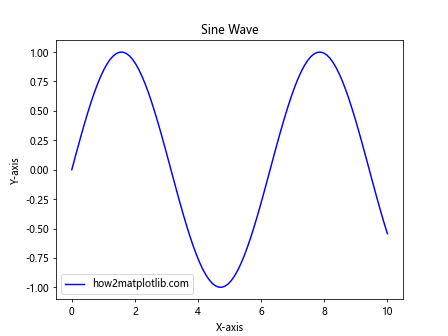
这个例子将图表保存为SVG矢量格式,这种格式可以无损放大,适合用于印刷或进一步编辑。
结论
在Matplotlib中更改线条颜色是一个强大的工具,可以极大地提高数据可视化的效果和可读性。从基本的颜色设置到高级的颜色映射和动态颜色变化,Matplotlib提供了丰富的选项来满足各种需求。通过合理使用颜色,我们可以突出重要信息,区分不同的数据系列,甚至传达额外的数据维度。
在选择颜色时,我们需要考虑数据的类型、图表的目的、以及观众的需求。对于科学可视化,准确性和清晰度是首要考虑因素;而对于商业展示,美观性和品牌一致性可能更为重要。无论如何,保持颜色的一致性、考虑可访问性,并确保颜色选择不会干扰数据的解释,这些都是制作高质量数据可视化的关键。
通过本文介绍的各种技巧和方法,读者应该能够自如地控制Matplotlib中的线条颜色,创建出既美观又有效的数据可视化作品。记住,颜色是一个强大的视觉工具,明智地使用它可以让你的数据故事更加生动和引人入胜。
 极客教程
极客教程