Matplotlib 中如何更改字体:全面指南
参考:How to Change Fonts in matplotlib
Matplotlib 是 Python 中最流行的数据可视化库之一,它提供了丰富的绘图功能和高度的可定制性。在数据可视化中,字体的选择和设置对于图表的整体美观度和可读性至关重要。本文将详细介绍如何在 Matplotlib 中更改字体,包括全局字体设置、局部字体设置、使用自定义字体等多个方面。
1. Matplotlib 中的字体系统
在深入探讨如何更改字体之前,我们需要了解 Matplotlib 中的字体系统。Matplotlib 使用一个字体管理器来处理字体相关的操作。这个字体管理器负责查找系统中可用的字体,并在绘图时应用指定的字体。
Matplotlib 支持多种字体格式,包括 TrueType (.ttf)、OpenType (.otf) 和 Type 1 (.pfa 和 .pfb) 等。默认情况下,Matplotlib 会使用系统中已安装的字体。但是,你也可以添加自定义字体或使用 Matplotlib 内置的字体。
让我们从一个简单的示例开始,看看默认情况下 Matplotlib 使用的字体:
import matplotlib.pyplot as plt

fig, ax = plt.subplots()
ax.set_title("Default Font in how2matplotlib.com")
ax.set_xlabel("X-axis")
ax.set_ylabel("Y-axis")
ax.text(0.5, 0.5, "Sample Text", ha='center', va='center')

plt.show()
Output:
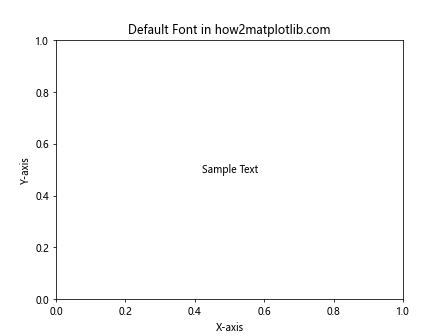
在这个示例中,我们创建了一个简单的图表,包含标题、坐标轴标签和一些文本。默认情况下,Matplotlib 会使用系统的默认字体。
2. 全局字体设置
如果你想在整个 Matplotlib 环境中统一更改字体,可以使用全局字体设置。这种方法会影响所有的图表元素,包括标题、轴标签、刻度标签等。
2.1 使用 rcParams 设置全局字体
rcParams 是 Matplotlib 的配置字典,通过修改它可以更改多种绘图参数,包括字体。以下是一个设置全局字体的示例:
import matplotlib.pyplot as plt
import matplotlib as mpl

mpl.rcParams['font.family'] = 'serif'
mpl.rcParams['font.serif'] = ['Times New Roman']

fig, ax = plt.subplots()
ax.set_title("Global Font Setting in how2matplotlib.com")
ax.set_xlabel("X-axis")
ax.set_ylabel("Y-axis")
ax.text(0.5, 0.5, "Sample Text", ha='center', va='center')

plt.show()
Output:
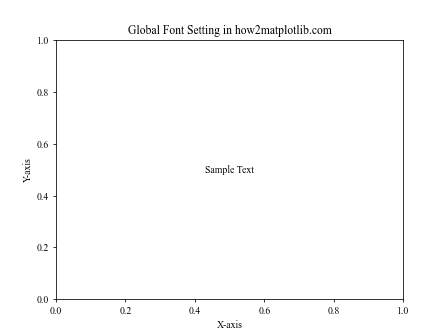
在这个例子中,我们将全局字体族设置为 ‘serif’,并指定使用 ‘Times New Roman’ 字体。这将影响图表中的所有文本元素。
2.2 使用样式文件设置全局字体
另一种设置全局字体的方法是使用 Matplotlib 的样式文件。你可以创建一个 .mplstyle 文件,在其中定义字体设置,然后在代码中应用这个样式。
首先,创建一个名为 custom_font.mplstyle 的文件,内容如下:
font.family: sans-serif
font.sans-serif: Arial, Helvetica, DejaVu Sans
然后,在你的 Python 代码中应用这个样式:
import matplotlib.pyplot as plt
import matplotlib as mpl

plt.style.use('custom_font.mplstyle')

fig, ax = plt.subplots()
ax.set_title("Style-based Font Setting in how2matplotlib.com")
ax.set_xlabel("X-axis")
ax.set_ylabel("Y-axis")
ax.text(0.5, 0.5, "Sample Text", ha='center', va='center')

plt.show()
这个方法的优点是可以轻松地在不同的项目或图表中切换字体设置。
3. 局部字体设置
有时候,你可能只想更改图表中特定元素的字体,而不是全局更改。Matplotlib 提供了多种方法来实现局部字体设置。
3.1 使用 fontdict 参数
许多 Matplotlib 函数和方法都接受一个 fontdict 参数,你可以通过这个参数来指定字体属性。以下是一个示例:
import matplotlib.pyplot as plt

fig, ax = plt.subplots()

title_font = {'family': 'serif', 'color': 'blue', 'weight': 'bold', 'size': 16}
label_font = {'family': 'sans-serif', 'color': 'darkred', 'weight': 'normal', 'size': 12}

ax.set_title("Font Settings with fontdict in how2matplotlib.com", fontdict=title_font)
ax.set_xlabel("X-axis", fontdict=label_font)
ax.set_ylabel("Y-axis", fontdict=label_font)
ax.text(0.5, 0.5, "Sample Text", ha='center', va='center')

plt.show()
Output:
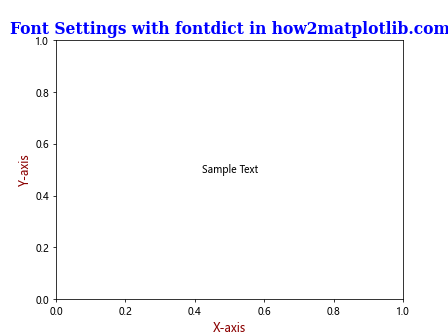
在这个例子中,我们为标题和轴标签分别设置了不同的字体属性。
3.2 使用 set_* 方法
对于某些图表元素,你可以使用特定的 set_* 方法来设置字体属性。这些方法通常提供更细粒度的控制:
import matplotlib.pyplot as plt

fig, ax = plt.subplots()

ax.set_title("Font Settings with set_* methods in how2matplotlib.com")
ax.set_xlabel("X-axis")
ax.set_ylabel("Y-axis")

title = ax.title
title.set_fontname('Comic Sans MS')
title.set_fontsize(16)
title.set_fontweight('bold')

xlabel = ax.xaxis.label
xlabel.set_fontname('Arial')
xlabel.set_fontsize(12)

ylabel = ax.yaxis.label
ylabel.set_fontname('Times New Roman')
ylabel.set_fontsize(12)
ylabel.set_fontstyle('italic')

plt.show()
Output:
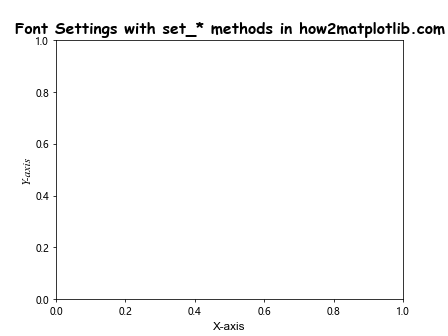
这个方法允许你精确控制每个文本元素的字体属性。
4. 使用自定义字体
有时,你可能想使用系统中没有安装的自定义字体。Matplotlib 允许你加载和使用自定义字体文件。
4.1 添加自定义字体
首先,你需要将字体文件(例如 .ttf 文件)放在 Matplotlib 可以访问的位置。然后,你可以使用 font_manager 模块来添加这个字体:
import matplotlib.pyplot as plt
from matplotlib import font_manager

# 添加自定义字体
font_path = '/path/to/your/custom_font.ttf'
font_manager.fontManager.addfont(font_path)

# 使用自定义字体
plt.rcParams['font.family'] = 'Your Custom Font Name'

fig, ax = plt.subplots()
ax.set_title("Custom Font in how2matplotlib.com")
ax.set_xlabel("X-axis")
ax.set_ylabel("Y-axis")
ax.text(0.5, 0.5, "Sample Text", ha='center', va='center')

plt.show()
确保将 ‘/path/to/your/custom_font.ttf’ 替换为你的字体文件的实际路径,并将 ‘Your Custom Font Name’ 替换为字体的实际名称。
4.2 使用 FontProperties
另一种使用自定义字体的方法是创建一个 FontProperties 对象:
import matplotlib.pyplot as plt
from matplotlib.font_manager import FontProperties

# 创建 FontProperties 对象
custom_font = FontProperties(fname='/path/to/your/custom_font.ttf')

fig, ax = plt.subplots()
ax.set_title("Custom Font with FontProperties in how2matplotlib.com", fontproperties=custom_font)
ax.set_xlabel("X-axis")
ax.set_ylabel("Y-axis")
ax.text(0.5, 0.5, "Sample Text", ha='center', va='center', fontproperties=custom_font)

plt.show()
这种方法的优点是可以在不影响其他元素的情况下,为特定的文本元素使用自定义字体。
5. 字体属性的细节调整
除了字体族和字体名称,Matplotlib 还允许你调整多种字体属性,如大小、粗细、样式等。
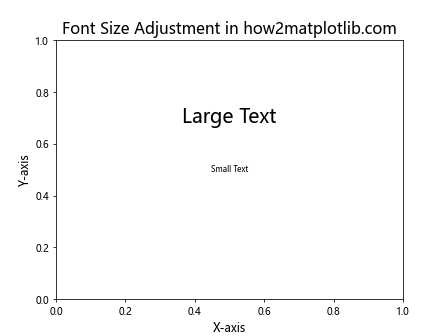
5.1 字体大小
你可以使用 fontsize 参数或 set_fontsize() 方法来调整字体大小:
import matplotlib.pyplot as plt

fig, ax = plt.subplots()

ax.set_title("Font Size Adjustment in how2matplotlib.com", fontsize=16)
ax.set_xlabel("X-axis", fontsize=12)
ax.set_ylabel("Y-axis", fontsize=12)
ax.text(0.5, 0.5, "Small Text", ha='center', va='center', fontsize=8)
ax.text(0.5, 0.7, "Large Text", ha='center', va='center', fontsize=20)

plt.show()
Output:
5.2 字体粗细
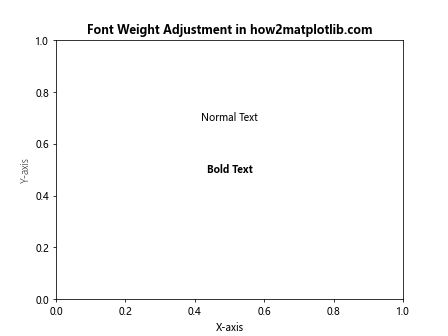
字体粗细可以通过 fontweight 参数或 set_fontweight() 方法来设置:
import matplotlib.pyplot as plt

fig, ax = plt.subplots()

ax.set_title("Font Weight Adjustment in how2matplotlib.com", fontweight='bold')
ax.set_xlabel("X-axis", fontweight='normal')
ax.set_ylabel("Y-axis", fontweight='light')
ax.text(0.5, 0.5, "Bold Text", ha='center', va='center', fontweight='bold')
ax.text(0.5, 0.7, "Normal Text", ha='center', va='center', fontweight='normal')

plt.show()
Output:
5.3 字体样式
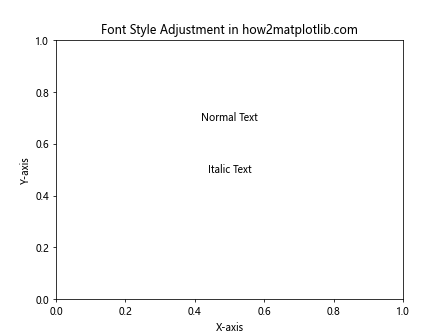
字体样式(如斜体)可以通过 fontstyle 参数或 set_fontstyle() 方法来设置:
import matplotlib.pyplot as plt

fig, ax = plt.subplots()

ax.set_title("Font Style Adjustment in how2matplotlib.com", fontstyle='italic')
ax.set_xlabel("X-axis", fontstyle='normal')
ax.set_ylabel("Y-axis", fontstyle='oblique')
ax.text(0.5, 0.5, "Italic Text", ha='center', va='center', fontstyle='italic')
ax.text(0.5, 0.7, "Normal Text", ha='center', va='center', fontstyle='normal')

plt.show()
Output:
6. 处理中文和其他非英语字符
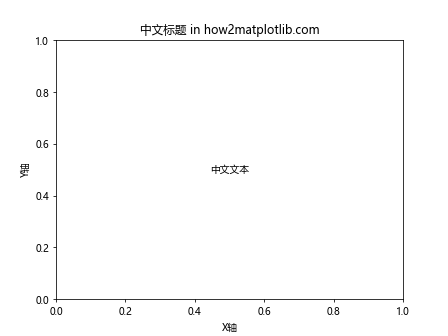
在处理中文或其他非英语字符时,可能会遇到显示问题。这通常是因为默认字体不支持这些字符。解决这个问题的方法是使用支持所需语言的字体。
6.1 使用支持中文的字体
对于中文,你可以使用像 “SimHei” 或 “Microsoft YaHei” 这样的字体:
import matplotlib.pyplot as plt
import matplotlib as mpl

mpl.rcParams['font.sans-serif'] = ['SimHei']
mpl.rcParams['axes.unicode_minus'] = False  # 解决负号显示问题

fig, ax = plt.subplots()
ax.set_title("中文标题 in how2matplotlib.com")
ax.set_xlabel("X轴")
ax.set_ylabel("Y轴")
ax.text(0.5, 0.5, "中文文本", ha='center', va='center')

plt.show()
Output:
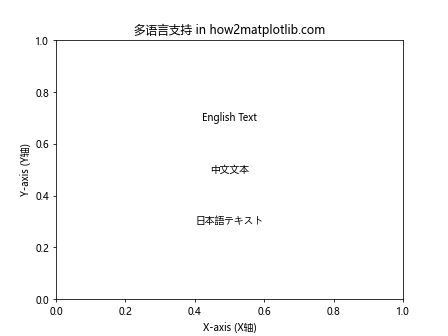
6.2 使用 Unicode 字体
如果你需要支持多种语言,可以考虑使用支持广泛 Unicode 范围的字体,如 “Arial Unicode MS”:
import matplotlib.pyplot as plt
import matplotlib as mpl

mpl.rcParams['font.sans-serif'] = ['Arial Unicode MS']

fig, ax = plt.subplots()
ax.set_title("多语言支持 in how2matplotlib.com")
ax.set_xlabel("X-axis (X轴)")
ax.set_ylabel("Y-axis (Y轴)")
ax.text(0.5, 0.7, "English Text", ha='center', va='center')
ax.text(0.5, 0.5, "中文文本", ha='center', va='center')
ax.text(0.5, 0.3, "日本語テキスト", ha='center', va='center')

plt.show()
Output:
7. 字体在不同操作系统上的兼容性
在不同的操作系统上,可用的字体可能会有所不同。为了确保你的图表在不同平台上都能正确显示,你可以提供一个字体列表,Matplotlib 会按顺序尝试使用这些字体。
import matplotlib.pyplot as plt
import matplotlib as mpl

mpl.rcParams['font.sans-serif'] = ['Helvetica', 'Arial', 'DejaVu Sans', 'SimHei']

fig, ax = plt.subplots()
ax.set_title("Cross-platform Font Compatibility in how2matplotlib.com")
ax.set_xlabel("X-axis")
ax.set_ylabel("Y-axis")
ax.text(0.5, 0.5, "Sample Text", ha='center', va='center')

plt.show()
Output:
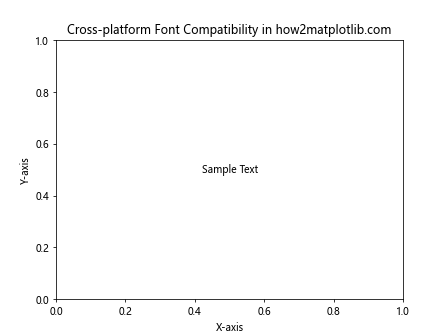
在这个例子中,Matplotlib 会首先尝试使用 Helvetica,如果不可用,则尝试 Arial,依此类推。
8. 使用 LaTeX 渲染文本
对于需要数学公式或特殊排版的场景,Matplotlib 支持使用 LaTeX 渲染文本。这需要你的系统安装了 LaTeX。
import matplotlib.pyplot as plt
import matplotlib as mpl

mpl.rcParams['text.usetex'] = True
mpl.rcParams['font.family'] = 'serif'
mpl.rcParams['font.serif'] = ['Computer Modern Roman']

fig, ax = plt.subplots()
ax.set_title(r"LaTeXRendering in how2matplotlib.com")
ax.set_xlabel(r"x-axis")
ax.set_ylabel(r"y-axis")
ax.text(0.5, 0.5, r"E = mc^2", ha='center', va='center')

plt.show()
使用 LaTeX 渲染可以得到高质量的数学公式和文本排版,但会增加图表生成的时间。
9. 动态调整字体大小
在某些情况下,你可能需要根据图表的大小动态调整字体大小。这在创建响应式或可缩放的图表时特别有用。
import matplotlib.pyplot as plt

def adjust_font_size(fig, base_size=12):
    width, height = fig.get_size_inches()
    scale_factor = min(width, height) / 8  # 假设 8 英寸是基准大小
    for item in ([fig.title, fig.xaxis.label, fig.yaxis.label] +
                 fig.get_axes()[0].get_xticklabels() +
                 fig.get_axes()[0].get_yticklabels()):
        item.set_fontsize(base_size * scale_factor)

fig, ax = plt.subplots(figsize=(10, 6))
ax.set_title("Dynamic Font Size in how2matplotlib.com")
ax.set_xlabel("X-axis")
ax.set_ylabel("Y-axis")
ax.text(0.5, 0.5, "Sample Text", ha='center', va='center')

adjust_font_size(fig)

plt.show()
这个例子定义了一个函数,根据图表的大小调整字体大小。这对于创建在不同设备或屏幕上都能良好显示的图表非常有用。
10. 字体效果和样式
Matplotlib 还提供了一些额外的字体效果和样式选项,可以增强文本的视觉效果。
10.1 文本阴影
你可以为文本添加阴影效果,使其在某些背景上更加醒目:
import matplotlib.pyplot as plt

fig, ax = plt.subplots()
ax.set_title("Text Shadow Effect in how2matplotlib.com")
ax.text(0.5, 0.5, "Shadow Text", ha='center', va='center', fontsize=20,
        bbox=dict(facecolor='white', edgecolor='none', alpha=0.7),
        path_effects=[plt.patheffects.withSimplePatchShadow()])

plt.show()
10.2 描边效果
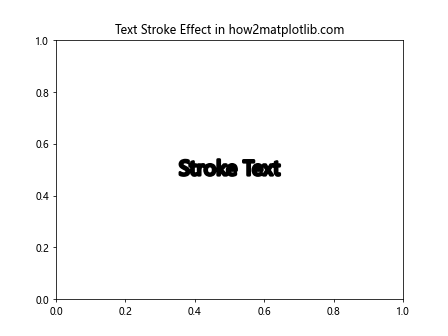
为文本添加描边可以增加其可读性,特别是在复杂背景上:
import matplotlib.pyplot as plt
import matplotlib.patheffects as path_effects

fig, ax = plt.subplots()
ax.set_title("Text Stroke Effect in how2matplotlib.com")
text = ax.text(0.5, 0.5, "Stroke Text", ha='center', va='center', fontsize=20)
text.set_path_effects([path_effects.Stroke(linewidth=3, foreground='black'),
                       path_effects.Normal()])

plt.show()
Output:
11. 字体在图例中的应用
在创建图例时,你可能想要为图例文本设置特定的字体样式:
import matplotlib.pyplot as plt

fig, ax = plt.subplots()
ax.plot([1, 2, 3], [1, 4, 9], label='y = x^2')
ax.plot([1, 2, 3], [1, 2, 3], label='y = x')

legend = ax.legend(title="Legend Title in how2matplotlib.com")
plt.setp(legend.get_title(), fontsize='large', fontweight='bold')
plt.setp(legend.get_texts(), fontsize='medium', fontstyle='italic')

plt.show()
Output:
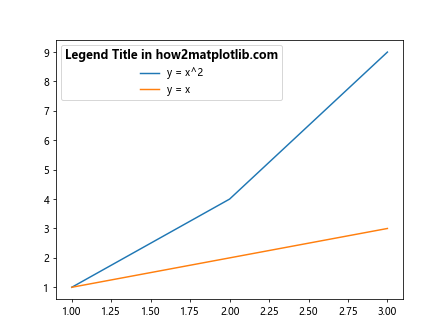
这个例子展示了如何为图例标题和图例项设置不同的字体样式。
12. 在子图中使用不同的字体
当你创建包含多个子图的复杂图表时,可能需要为不同的子图设置不同的字体样式:
import matplotlib.pyplot as plt

fig, (ax1, ax2) = plt.subplots(1, 2, figsize=(10, 5))

ax1.set_title("Subplot 1 in how2matplotlib.com", fontfamily='serif', fontsize=14)
ax1.set_xlabel("X-axis", fontfamily='serif')
ax1.set_ylabel("Y-axis", fontfamily='serif')

ax2.set_title("Subplot 2 in how2matplotlib.com", fontfamily='sans-serif', fontsize=14)
ax2.set_xlabel("X-axis", fontfamily='sans-serif')
ax2.set_ylabel("Y-axis", fontfamily='sans-serif')

plt.tight_layout()
plt.show()
Output:
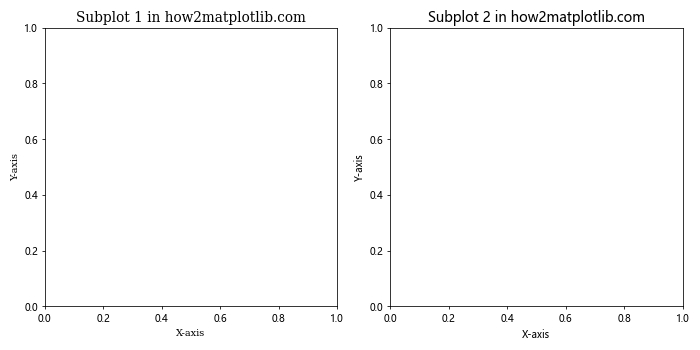
这个例子创建了两个子图,每个子图使用不同的字体族。
结论
在 Matplotlib 中更改字体是一个强大而灵活的功能,可以显著提升你的数据可视化效果。从全局字体设置到局部字体调整,从使用系统字体到加载自定义字体,Matplotlib 提供了多种方法来满足不同的需求。通过合理使用字体设置,你可以创建出既美观又易读的图表,有效地传达你的数据故事。
记住,选择合适的字体不仅关乎美观,还要考虑可读性和适用性。在不同的场景中,可能需要不同的字体策略。例如,在学术论文中,你可能更倾向于使用严肃的衬线字体;而在网页或演示文稿中,无衬线字体可能更为合适。
最后,不要忘记在选择字体时考虑跨平台兼容性和性能影响。某些复杂的字体设置可能会增加图表渲染的时间,特别是在处理大量数据或创建动态图表时。通过平衡美观性、可读性和性能,你可以创建出既专业又高效的数据可视化作品。
 极客教程
极客教程