如何调整Seaborn图中的刻度数量
参考:How to Adjust the Number of Ticks in Seaborn Plots
在数据可视化中,合适的刻度数量可以使图表更加清晰易读。Seaborn是基于matplotlib的高级绘图库,它提供了更多样化的图表类型和美化功能。本文将详细介绍如何在使用Seaborn进行数据可视化时调整图表的刻度数量。
1. Seaborn和Matplotlib的基本介绍
Seaborn是一个建立在matplotlib基础上的数据可视化库,它提供了一系列高级的图表绘制功能,能够使matplotlib的图表更加美观,同时简化了很多绘图代码。在Seaborn中调整刻度数量,实际上还是依赖于matplotlib的底层实现。
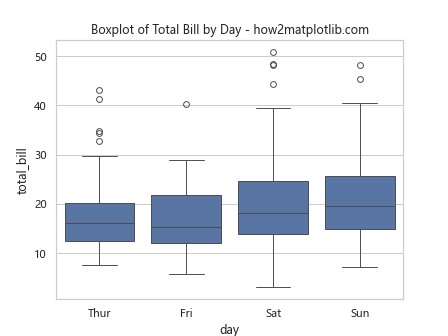
示例代码1:基本的Seaborn绘图
import seaborn as sns
import matplotlib.pyplot as plt

data = sns.load_dataset("tips")
sns.set(style="whitegrid")
ax = sns.boxplot(x="day", y="total_bill", data=data)
ax.set_title("Boxplot of Total Bill by Day - how2matplotlib.com")
plt.show()
Output:

2. 调整刻度数量的方法
调整刻度数量主要依赖于matplotlib的Locator对象,通过设置MaxNLocator可以指定刻度的最大数量。
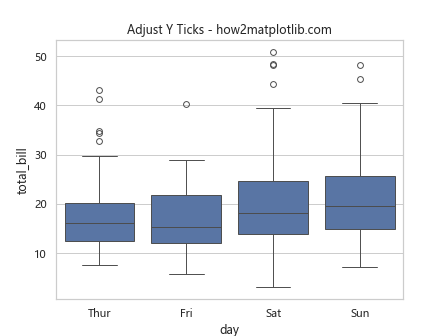
示例代码2:调整y轴刻度数量
import seaborn as sns
import matplotlib.pyplot as plt
from matplotlib.ticker import MaxNLocator

data = sns.load_dataset("tips")
sns.set(style="whitegrid")
ax = sns.boxplot(x="day", y="total_bill", data=data)
ax.yaxis.set_major_locator(MaxNLocator(6))  # 设置y轴最多6个刻度
ax.set_title("Adjust Y Ticks - how2matplotlib.com")
plt.show()
Output:

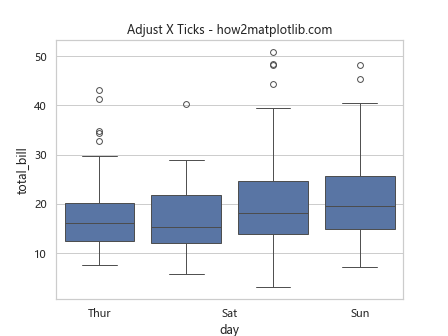
示例代码3:调整x轴刻度数量
import seaborn as sns
import matplotlib.pyplot as plt
from matplotlib.ticker import MaxNLocator

data = sns.load_dataset("tips")
sns.set(style="whitegrid")
ax = sns.boxplot(x="day", y="total_bill", data=data)
ax.xaxis.set_major_locator(MaxNLocator(3))  # 设置x轴最多3个刻度
ax.set_title("Adjust X Ticks - how2matplotlib.com")
plt.show()
Output:

3. 使用不同的Locator调整刻度
matplotlib提供了多种Locator来调整刻度,例如AutoLocator, MultipleLocator, FixedLocator等。
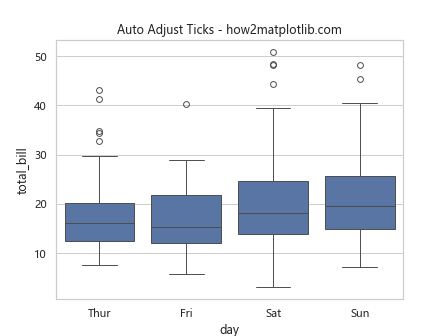
示例代码4:使用AutoLocator自动调整刻度
import seaborn as sns
import matplotlib.pyplot as plt
from matplotlib.ticker import AutoLocator

data = sns.load_dataset("tips")
sns.set(style="whitegrid")
ax = sns.boxplot(x="day", y="total_bill", data=data)
ax.yaxis.set_major_locator(AutoLocator())  # 自动调整刻度
ax.set_title("Auto Adjust Ticks - how2matplotlib.com")
plt.show()
Output:

 极客教程
极客教程