Matplotlib中如何调整坐标轴标签位置:全面指南
参考:How To Adjust Position of Axis Labels in Matplotlib
Matplotlib是Python中最流行的数据可视化库之一,它提供了丰富的功能来创建各种类型的图表和绘图。在使用Matplotlib创建图表时,调整坐标轴标签的位置是一个常见的需求,它可以帮助我们更好地展示数据和美化图表。本文将详细介绍如何在Matplotlib中调整坐标轴标签的位置,包括x轴、y轴以及整个坐标轴系统的标签位置调整。
1. 基本概念
在开始之前,我们需要了解一些基本概念:
- 坐标轴(Axis):指x轴和y轴。
- 标签(Label):指坐标轴上的文字说明,通常用来描述轴代表的含义。
- 刻度(Tick):指坐标轴上的刻度线和对应的数值。
在Matplotlib中,我们可以通过多种方法来调整这些元素的位置。
2. 设置坐标轴标签
首先,让我们看看如何设置坐标轴的标签。
import matplotlib.pyplot as plt

fig, ax = plt.subplots()
ax.set_xlabel('X轴 - how2matplotlib.com')
ax.set_ylabel('Y轴 - how2matplotlib.com')
plt.title('基本坐标轴标签 - how2matplotlib.com')
plt.show()
Output:
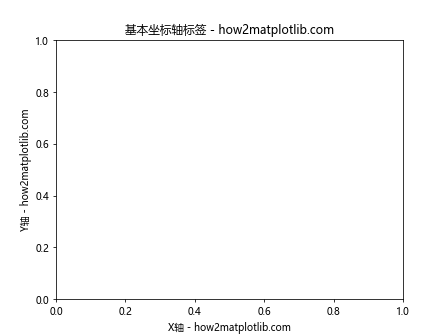
在这个例子中,我们使用set_xlabel()和set_ylabel()方法来设置x轴和y轴的标签。这是设置坐标轴标签的最基本方法。
3. 调整标签位置
3.1 使用set_label_coords()方法
set_label_coords()方法允许我们精确地设置标签的位置。
import matplotlib.pyplot as plt

fig, ax = plt.subplots()
ax.set_xlabel('X轴 - how2matplotlib.com')
ax.set_ylabel('Y轴 - how2matplotlib.com')

# 调整x轴标签位置
ax.xaxis.set_label_coords(0.5, -0.1)

# 调整y轴标签位置
ax.yaxis.set_label_coords(-0.1, 0.5)

plt.title('使用set_label_coords()调整标签位置 - how2matplotlib.com')
plt.show()
Output:
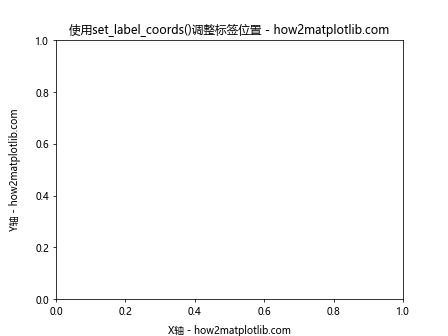
在这个例子中,我们使用set_label_coords()方法来调整x轴和y轴标签的位置。第一个参数是x坐标,第二个参数是y坐标。坐标系统是相对于整个图表的,(0, 0)是左下角,(1, 1)是右上角。
3.2 使用labelpad参数
另一种调整标签位置的方法是使用labelpad参数。这个参数控制标签与轴之间的距离。
import matplotlib.pyplot as plt

fig, ax = plt.subplots()
ax.set_xlabel('X轴 - how2matplotlib.com', labelpad=15)
ax.set_ylabel('Y轴 - how2matplotlib.com', labelpad=20)
plt.title('使用labelpad调整标签位置 - how2matplotlib.com')
plt.show()
Output:
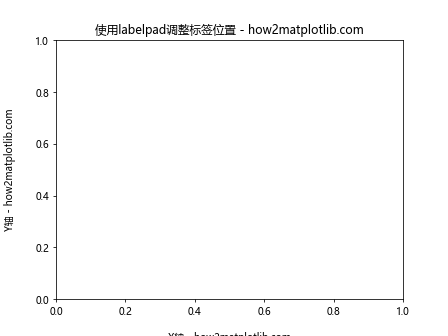
在这个例子中,我们使用labelpad参数来增加标签与轴之间的距离。x轴标签向下移动了15个单位,y轴标签向左移动了20个单位。
4. 旋转标签
有时候,我们可能需要旋转标签以适应更长的文本或改善布局。
import matplotlib.pyplot as plt

fig, ax = plt.subplots()
ax.set_xlabel('这是一个很长的X轴标签 - how2matplotlib.com', rotation=45)
ax.set_ylabel('这是一个很长的Y轴标签 - how2matplotlib.com', rotation=0)
plt.title('旋转坐标轴标签 - how2matplotlib.com')
plt.tight_layout()
plt.show()
Output:
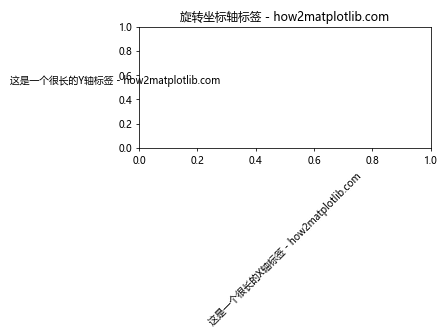
在这个例子中,我们将x轴标签旋转了45度,将y轴标签旋转到水平位置(0度)。rotation参数接受度数作为输入。
5. 调整刻度标签位置
除了主要的轴标签,我们还可以调整刻度标签的位置。
5.1 调整刻度标签的位置和旋转
import matplotlib.pyplot as plt
import numpy as np

fig, ax = plt.subplots()
x = np.arange(0, 5, 0.5)
y = np.sin(x)
ax.plot(x, y)

ax.set_xticks(x)
ax.set_xticklabels([f'X{i} - how2matplotlib.com' for i in range(len(x))], rotation=45, ha='right')
plt.title('调整刻度标签位置和旋转 - how2matplotlib.com')
plt.tight_layout()
plt.show()
Output:
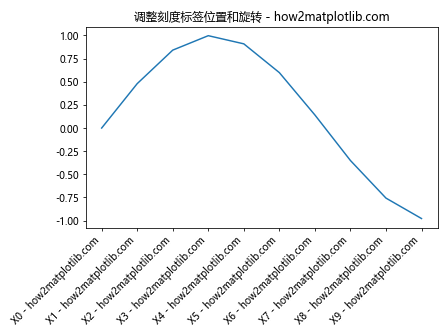
在这个例子中,我们自定义了x轴的刻度标签,并将它们旋转45度。ha='right'参数使标签右对齐,这通常可以改善倾斜标签的外观。
5.2 使用tick_params()调整刻度标签
tick_params()方法提供了一种更灵活的方式来调整刻度和刻度标签。
import matplotlib.pyplot as plt
import numpy as np

fig, ax = plt.subplots()
x = np.arange(0, 5, 0.5)
y = np.cos(x)
ax.plot(x, y)

ax.tick_params(axis='x', which='major', pad=15, labelrotation=30)
ax.tick_params(axis='y', which='major', pad=10, labelsize=8)

plt.title('使用tick_params()调整刻度标签 - how2matplotlib.com')
plt.tight_layout()
plt.show()
Output:
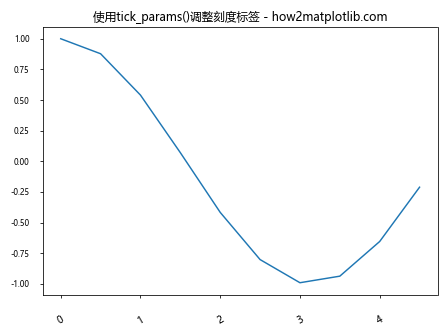
在这个例子中,我们使用tick_params()方法来调整x轴和y轴的刻度标签。我们增加了x轴标签的内边距,旋转了标签,并减小了y轴标签的字体大小。
6. 调整整个坐标轴系统的位置
有时候,我们可能需要调整整个坐标轴系统的位置。
6.1 使用subplots_adjust()
import matplotlib.pyplot as plt
import numpy as np

fig, ax = plt.subplots()
x = np.linspace(0, 10, 100)
y = np.sin(x)
ax.plot(x, y)

ax.set_xlabel('X轴 - how2matplotlib.com')
ax.set_ylabel('Y轴 - how2matplotlib.com')
plt.title('调整坐标轴系统位置 - how2matplotlib.com')

plt.subplots_adjust(left=0.2, right=0.9, top=0.9, bottom=0.2)
plt.show()
Output:
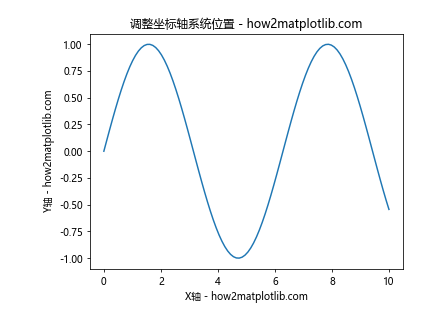
在这个例子中,我们使用subplots_adjust()方法来调整整个坐标轴系统的位置。我们增加了左边距和下边距,减小了右边距和上边距,这样整个坐标轴系统就向右下方移动了。
6.2 使用tight_layout()
tight_layout()函数可以自动调整子图参数,以给定的填充适合图形。
import matplotlib.pyplot as plt
import numpy as np

fig, (ax1, ax2) = plt.subplots(2, 1, figsize=(6, 8))

x = np.linspace(0, 10, 100)
ax1.plot(x, np.sin(x))
ax1.set_xlabel('X轴 - how2matplotlib.com')
ax1.set_ylabel('sin(x) - how2matplotlib.com')
ax1.set_title('正弦函数 - how2matplotlib.com')

ax2.plot(x, np.cos(x))
ax2.set_xlabel('X轴 - how2matplotlib.com')
ax2.set_ylabel('cos(x) - how2matplotlib.com')
ax2.set_title('余弦函数 - how2matplotlib.com')

plt.tight_layout()
plt.show()
Output:
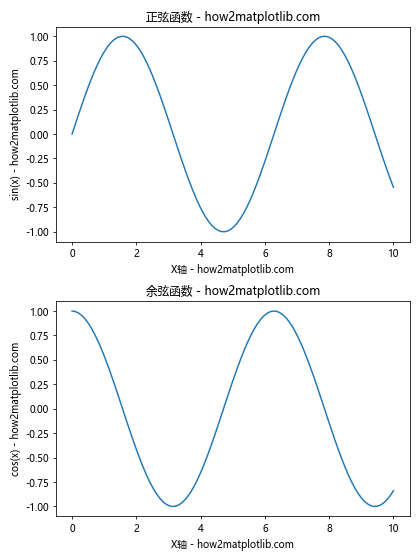
在这个例子中,我们创建了两个子图,并使用tight_layout()函数来自动调整它们的布局。这个函数会尝试最小化重叠并使用图形区域。
7. 高级技巧
7.1 使用Text对象
对于更高级的标签位置控制,我们可以使用Text对象。
import matplotlib.pyplot as plt
import numpy as np

fig, ax = plt.subplots()
x = np.linspace(0, 10, 100)
y = np.sin(x)
ax.plot(x, y)

ax.set_xlabel('X轴 - how2matplotlib.com')
ax.set_ylabel('Y轴 - how2matplotlib.com')

# 创建一个Text对象作为自定义标签
custom_label = ax.text(0.5, -0.15, '自定义X轴标签 - how2matplotlib.com',
                       transform=ax.transAxes, ha='center', va='center')

plt.title('使用Text对象创建自定义标签 - how2matplotlib.com')
plt.show()
Output:
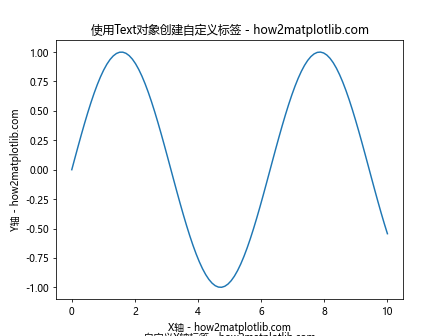
在这个例子中,我们使用text()方法创建了一个Text对象作为自定义的x轴标签。transform=ax.transAxes参数使得我们可以使用轴坐标系统(0到1)来定位文本。
7.2 使用注释
注释(Annotation)是另一种可以用来创建灵活的标签的方法。
import matplotlib.pyplot as plt
import numpy as np

fig, ax = plt.subplots()
x = np.linspace(0, 10, 100)
y = np.sin(x)
ax.plot(x, y)

ax.set_xlabel('X轴 - how2matplotlib.com')
ax.set_ylabel('Y轴 - how2matplotlib.com')

# 创建一个注释作为自定义标签
ax.annotate('自定义Y轴标签 - how2matplotlib.com', xy=(0, 0.5), xytext=(-0.2, 0.5),
            textcoords='axes fraction', rotation=90, va='center', ha='center',
            bbox=dict(boxstyle='round,pad=0.5', fc='yellow', alpha=0.5),
            arrowprops=dict(arrowstyle='->', connectionstyle='arc3,rad=0'))

plt.title('使用注释创建自定义标签 - how2matplotlib.com')
plt.show()
Output:
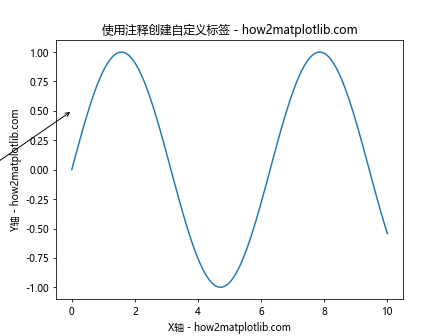
在这个例子中,我们使用annotate()方法创建了一个注释作为自定义的y轴标签。我们还添加了一个边框和一个箭头来指向坐标轴。
8. 处理重叠的标签
当处理大量数据或长标签时,标签重叠可能成为一个问题。以下是一些处理这种情况的技巧:
8.1 使用plt.setp()旋转标签
import matplotlib.pyplot as plt
import numpy as np

fig, ax = plt.subplots(figsize=(10, 6))
x = np.arange(20)
y = np.random.rand(20)
ax.bar(x, y)

ax.set_xticks(x)
ax.set_xticklabels([f'长标签{i} - how2matplotlib.com' for i in x])

plt.setp(ax.get_xticklabels(), rotation=45, ha='right')

plt.title('使用plt.setp()旋转标签 - how2matplotlib.com')
plt.tight_layout()
plt.show()
Output:
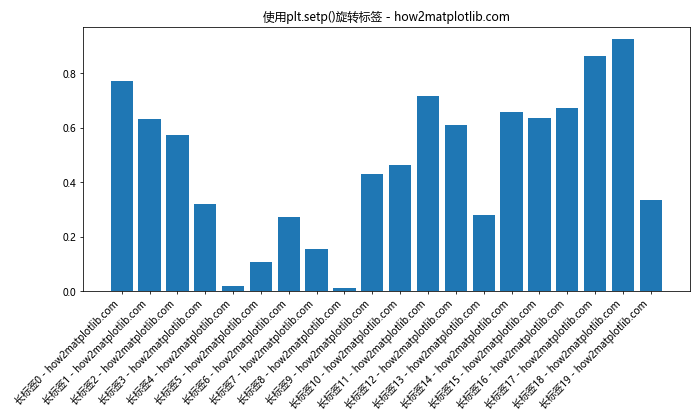
在这个例子中,我们使用plt.setp()函数来旋转x轴的刻度标签,以避免它们重叠。
8.2 使用FixedLocator和FixedFormatter
对于更复杂的情况,我们可以使用FixedLocator和FixedFormatter来完全控制刻度的位置和标签。
import matplotlib.pyplot as plt
import matplotlib.ticker as ticker
import numpy as np

fig, ax = plt.subplots(figsize=(10, 6))
x = np.linspace(0, 10, 100)
y = np.sin(x)
ax.plot(x, y)

# 创建一个FixedLocator
locator = ticker.FixedLocator([0, np.pi/2, np.pi, 3*np.pi/2, 2*np.pi])
ax.xaxis.set_major_locator(locator)

# 创建一个FixedFormatter
formatter = ticker.FixedFormatter(['0', 'π/2', 'π', '3π/2', '2π'])
ax.xaxis.set_major_formatter(formatter)

plt.title('使用FixedLocator和FixedFormatter - how2matplotlib.com')
plt.show()
Output:
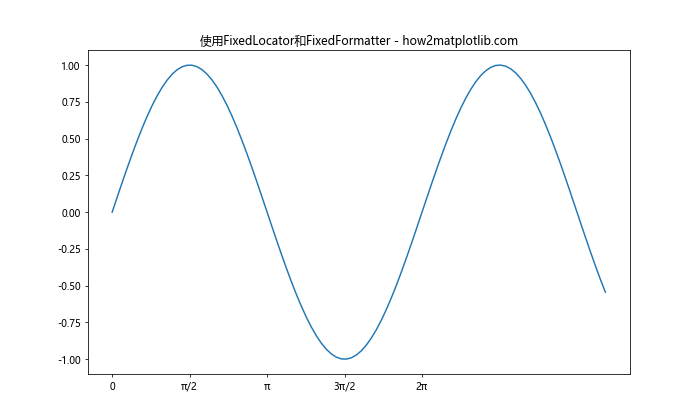
在这个例子中,我们使用FixedLocator来指定刻度的确切位置,使用FixedFormatter来指定这些位置的标签。这给了我们对刻度和标签的完全控制。
9. 在3D图中调整标签位置
Matplotlib也支持3D图,在3D图中调整标签位置有一些特殊的考虑。
import matplotlib.pyplot as plt
from mpl_toolkits.mplot3d import Axes3D
import numpy as np

fig = plt.figure(figsize=(10, 7))
ax = fig.add_subplot(111, projection='3d')

# 创建一些示例数据
x = np.linspace(-5, 5, 100)
y = np.linspace(-5, 5, 100)
X, Y = np.meshgrid(x, y)
Z = np.sin(np.sqrt(X**2 + Y**2))

# 绘制表面
surf = ax.plot_surface(X, Y, Z)

# 设置标签
axax.set_xlabel('X轴 - how2matplotlib.com')
ax.set_ylabel('Y轴 - how2matplotlib.com')
ax.set_zlabel('Z轴 - how2matplotlib.com')

# 调整标签位置
ax.xaxis.set_rotate_label(False)
ax.yaxis.set_rotate_label(False)
ax.zaxis.set_rotate_label(False)
ax.xaxis.labelpad = 20
ax.yaxis.labelpad = 20
ax.zaxis.labelpad = 20

plt.title('3D图中调整标签位置 - how2matplotlib.com')
plt.show()
在这个3D图的例子中,我们使用set_rotate_label(False)来防止标签自动旋转,并使用labelpad参数来调整标签与轴的距离。这在3D图中特别有用,因为默认的标签位置可能不总是最佳的。
10. 使用样式和主题
Matplotlib提供了多种预定义的样式和主题,这些可以影响标签的位置和外观。
import matplotlib.pyplot as plt
import numpy as np

# 使用'ggplot'样式
plt.style.use('ggplot')

fig, ax = plt.subplots()
x = np.linspace(0, 10, 100)
y = np.sin(x)
ax.plot(x, y)

ax.set_xlabel('X轴 - how2matplotlib.com')
ax.set_ylabel('Y轴 - how2matplotlib.com')
plt.title('使用ggplot样式 - how2matplotlib.com')
plt.show()
Output:
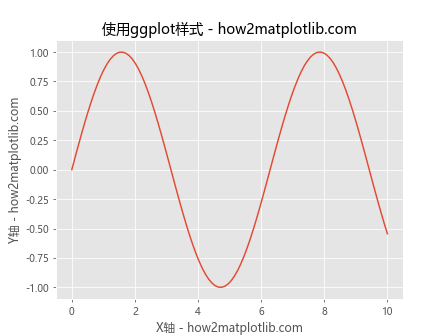
在这个例子中,我们使用了’ggplot’样式,这会改变图表的整体外观,包括标签的位置和样式。
11. 处理多子图的标签位置
当处理多个子图时,调整标签位置可能会变得更加复杂。以下是一个处理多子图标签的例子:
import matplotlib.pyplot as plt
import numpy as np

fig, axs = plt.subplots(2, 2, figsize=(12, 10))
fig.suptitle('多子图标签位置调整 - how2matplotlib.com', fontsize=16)

x = np.linspace(0, 10, 100)

for i, ax in enumerate(axs.flat):
    ax.plot(x, np.sin(x + i*np.pi/4))
    ax.set_xlabel(f'X轴 {i+1} - how2matplotlib.com')
    ax.set_ylabel(f'Y轴 {i+1} - how2matplotlib.com')
    ax.label_outer()  # 只显示外部边缘的标签

plt.tight_layout()
plt.show()
Output:
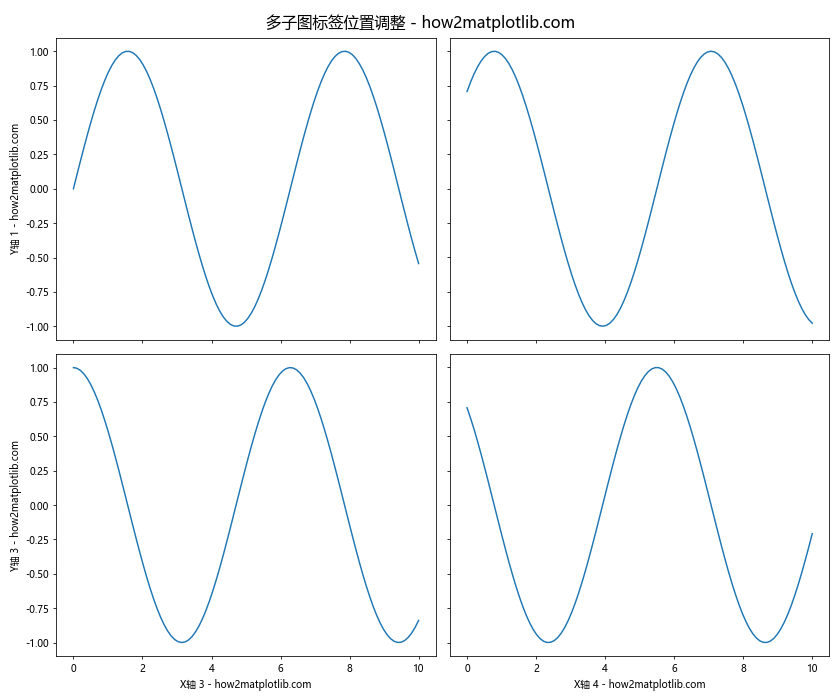
在这个例子中,我们创建了一个2×2的子图网格。我们使用label_outer()方法来只显示外部边缘的标签,这可以减少标签重叠的问题。
12. 使用GridSpec进行更灵活的布局
对于更复杂的布局,我们可以使用GridSpec来精确控制子图的位置和大小,这也会影响标签的位置。
import matplotlib.pyplot as plt
import matplotlib.gridspec as gridspec
import numpy as np

fig = plt.figure(figsize=(12, 8))
gs = gridspec.GridSpec(2, 2, width_ratios=[1, 2], height_ratios=[2, 1])

ax1 = fig.add_subplot(gs[0, 0])
ax2 = fig.add_subplot(gs[0, 1])
ax3 = fig.add_subplot(gs[1, :])

x = np.linspace(0, 10, 100)

ax1.plot(x, np.sin(x))
ax1.set_title('子图1 - how2matplotlib.com')
ax1.set_xlabel('X1 - how2matplotlib.com')
ax1.set_ylabel('Y1 - how2matplotlib.com')

ax2.plot(x, np.cos(x))
ax2.set_title('子图2 - how2matplotlib.com')
ax2.set_xlabel('X2 - how2matplotlib.com')
ax2.set_ylabel('Y2 - how2matplotlib.com')

ax3.plot(x, np.tan(x))
ax3.set_title('子图3 - how2matplotlib.com')
ax3.set_xlabel('X3 - how2matplotlib.com')
ax3.set_ylabel('Y3 - how2matplotlib.com')

plt.tight_layout()
plt.show()
Output:
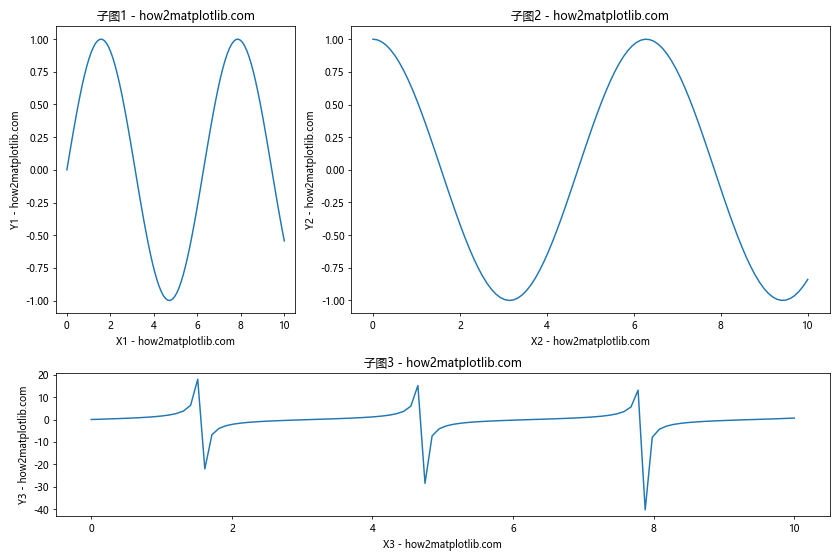
在这个例子中,我们使用GridSpec创建了一个不规则的子图布局。这种方法允许我们更精细地控制每个子图的大小和位置,从而更好地控制标签的位置。
13. 使用constrained_layout
constrained_layout是Matplotlib中的一个新特性,它可以自动调整子图之间的间距,以避免重叠。
import matplotlib.pyplot as plt
import numpy as np

fig, axs = plt.subplots(2, 2, constrained_layout=True, figsize=(12, 10))
fig.suptitle('使用constrained_layout - how2matplotlib.com', fontsize=16)

x = np.linspace(0, 10, 100)

for i, ax in enumerate(axs.flat):
    ax.plot(x, np.sin(x + i*np.pi/4))
    ax.set_xlabel(f'X轴 {i+1} - how2matplotlib.com')
    ax.set_ylabel(f'Y轴 {i+1} - how2matplotlib.com')
    ax.set_title(f'子图 {i+1} - how2matplotlib.com')

plt.show()
Output:
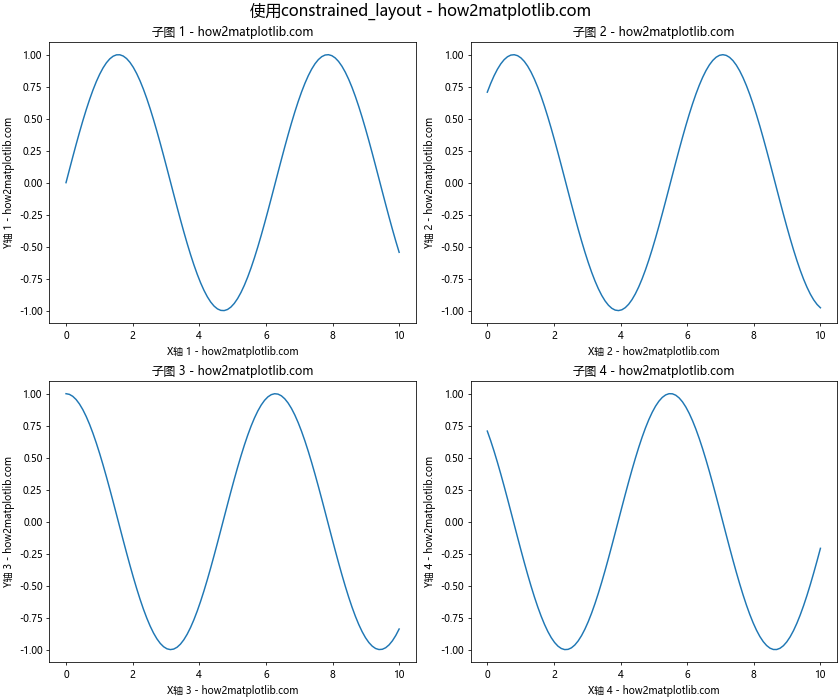
在这个例子中,我们在创建图形时使用了constrained_layout=True参数。这会自动调整子图之间的间距,以确保标签不会重叠。
14. 使用ax.spines来调整轴的位置
有时,我们可能想要调整整个轴的位置,这也会影响标签的位置。
import matplotlib.pyplot as plt
import numpy as np

fig, ax = plt.subplots(figsize=(10, 6))

x = np.linspace(0, 10, 100)
y = np.sin(x)
ax.plot(x, y)

# 移动左边和底部的轴线到数据空间的零点
ax.spines['left'].set_position('zero')
ax.spines['bottom'].set_position('zero')

# 隐藏顶部和右边的轴线
ax.spines['top'].set_visible(False)
ax.spines['right'].set_visible(False)

# 调整标签位置
ax.xaxis.set_label_coords(1.05, 0.5)
ax.yaxis.set_label_coords(0.5, 1.05)

ax.set_xlabel('X轴 - how2matplotlib.com')
ax.set_ylabel('Y轴 - how2matplotlib.com')
plt.title('使用ax.spines调整轴位置 - how2matplotlib.com')
plt.show()
Output:
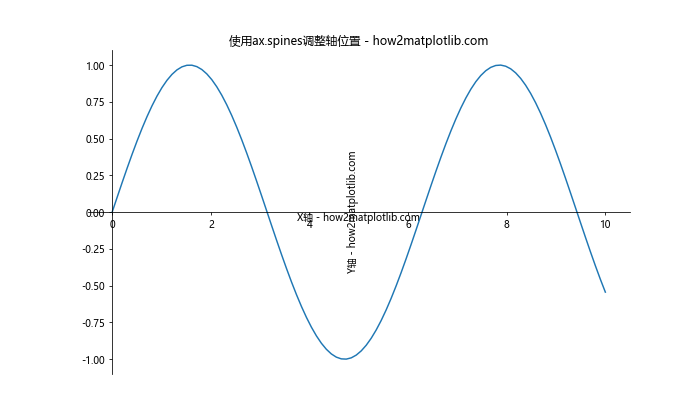
在这个例子中,我们移动了x轴和y轴到数据空间的零点,并隐藏了顶部和右边的轴线。然后,我们调整了标签的位置以适应新的轴位置。
15. 结论
调整Matplotlib中的坐标轴标签位置是一个强大的工具,可以极大地改善图表的可读性和美观性。通过本文介绍的各种方法,你应该能够处理大多数标签位置调整的需求。记住,最佳的标签位置往往取决于你的具体数据和图表类型,所以不要害怕尝试不同的方法来找到最适合你需求的解决方案。
在实践中,你可能需要结合使用多种技术来达到理想的效果。例如,你可能需要同时调整标签的位置、旋转角度和字体大小。此外,使用tight_layout()或constrained_layout等自动布局工具可以帮助你快速得到一个好的起点,然后你可以在此基础上进行微调。
最后,请记住Matplotlib是一个非常灵活的库,几乎总有方法可以实现你想要的效果。如果本文中的方法无法满足你的特定需求,不要犹豫查阅Matplotlib的官方文档或寻求社区的帮助。继续实践和探索,你将能够创建出既信息丰富又视觉吸引的图表。
 极客教程
极客教程