Matplotlib中添加文本的全面指南
参考:How to add text to Matplotlib
Matplotlib是Python中最流行的数据可视化库之一,它提供了丰富的功能来创建各种类型的图表和绘图。在数据可视化中,添加文本是一个非常重要的方面,它可以帮助我们更好地解释和标注图表。本文将全面介绍如何在Matplotlib中添加文本,包括基本文本、标题、轴标签、注释、文本框等多种文本元素的添加方法。
1. 基本文本添加
在Matplotlib中,最基本的文本添加方法是使用text()函数。这个函数允许我们在图表的任意位置添加文本。
1.1 使用text()函数
text()函数的基本语法如下:
import matplotlib.pyplot as plt

fig, ax = plt.subplots()
ax.text(x, y, 'Text content', fontsize=12, color='red')
ax.set_xlim(0, 10)
ax.set_ylim(0, 10)
ax.set_title('How to add text in Matplotlib - how2matplotlib.com')
plt.show()
在这个例子中,我们创建了一个空白的图表,并在坐标(x, y)处添加了一段文本。fontsize参数设置文本大小,color参数设置文本颜色。
1.2 调整文本属性
我们可以通过设置不同的参数来调整文本的各种属性,如字体、大小、颜色、对齐方式等。
import matplotlib.pyplot as plt

fig, ax = plt.subplots()
ax.text(0.5, 0.5, 'Customized Text - how2matplotlib.com',
        fontsize=15, fontweight='bold',
        color='blue', alpha=0.8,
        ha='center', va='center',
        rotation=45,
        bbox=dict(facecolor='yellow', edgecolor='red', alpha=0.3))
ax.set_xlim(0, 1)
ax.set_ylim(0, 1)
plt.show()
Output:
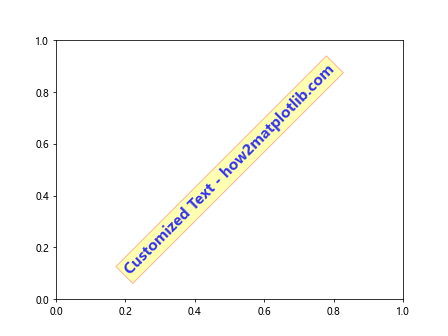
在这个例子中,我们设置了更多的文本属性:
– fontsize:字体大小
– fontweight:字体粗细
– color:文本颜色
– alpha:透明度
– ha和va:水平和垂直对齐方式
– rotation:旋转角度
– bbox:文本框属性
2. 添加标题和轴标签
标题和轴标签是图表中最常见的文本元素,它们对于解释图表内容至关重要。
2.1 添加标题
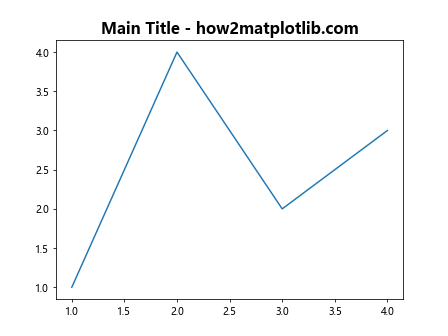
使用set_title()方法可以为图表添加标题:
import matplotlib.pyplot as plt

fig, ax = plt.subplots()
ax.plot([1, 2, 3, 4], [1, 4, 2, 3])
ax.set_title('Main Title - how2matplotlib.com', fontsize=16, fontweight='bold')
plt.show()
Output:
2.2 添加轴标签
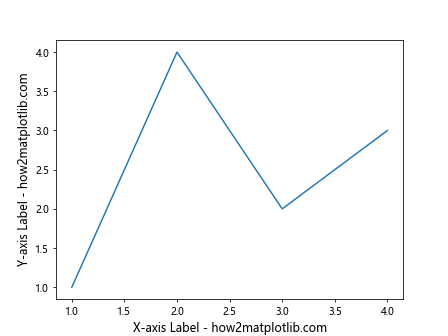
使用set_xlabel()和set_ylabel()方法可以为x轴和y轴添加标签:
import matplotlib.pyplot as plt

fig, ax = plt.subplots()
ax.plot([1, 2, 3, 4], [1, 4, 2, 3])
ax.set_xlabel('X-axis Label - how2matplotlib.com', fontsize=12)
ax.set_ylabel('Y-axis Label - how2matplotlib.com', fontsize=12)
plt.show()
Output:
2.3 调整标题和轴标签的位置
我们可以通过设置参数来调整标题和轴标签的位置:
import matplotlib.pyplot as plt

fig, ax = plt.subplots()
ax.plot([1, 2, 3, 4], [1, 4, 2, 3])
ax.set_title('Adjusted Title - how2matplotlib.com', pad=20)
ax.set_xlabel('X-axis Label - how2matplotlib.com', labelpad=15)
ax.set_ylabel('Y-axis Label - how2matplotlib.com', labelpad=15)
plt.show()
Output:
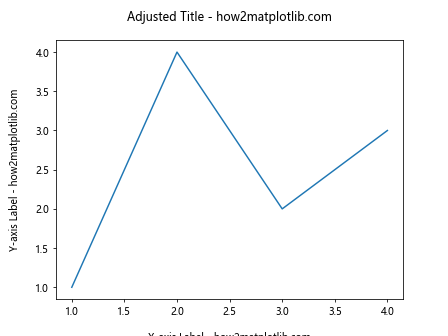
在这个例子中,pad和labelpad参数用于调整标题和轴标签与图表的距离。
3. 添加注释
注释是一种特殊的文本,通常用于标注图表中的特定点或区域。Matplotlib提供了annotate()函数来添加注释。
3.1 基本注释
import matplotlib.pyplot as plt

fig, ax = plt.subplots()
ax.plot([1, 2, 3, 4], [1, 4, 2, 3])
ax.annotate('Peak Point - how2matplotlib.com', xy=(2, 4), xytext=(3, 4),
            arrowprops=dict(facecolor='black', shrink=0.05))
plt.show()
Output:
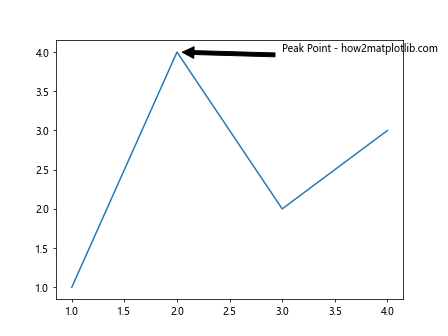
在这个例子中,xy参数指定了被注释的点的坐标,xytext参数指定了注释文本的位置,arrowprops参数用于设置箭头的属性。
3.2 高级注释
我们可以使用更多的参数来自定义注释的样式:
import matplotlib.pyplot as plt

fig, ax = plt.subplots()
ax.plot([1, 2, 3, 4], [1, 4, 2, 3])
ax.annotate('Detailed Annotation - how2matplotlib.com',
            xy=(2, 4), xytext=(3, 1),
            arrowprops=dict(facecolor='red', shrink=0.05, width=2, headwidth=8),
            bbox=dict(boxstyle="round,pad=0.3", fc="yellow", ec="b", lw=2),
            fontsize=10, ha='center', va='center')
plt.show()
Output:
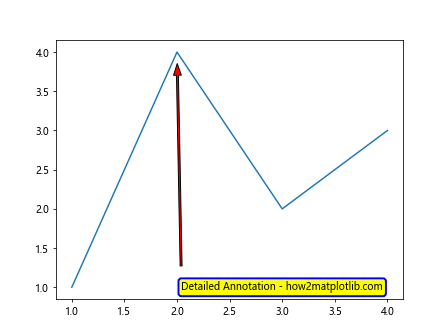
在这个例子中,我们使用了更多的参数来自定义注释的外观,包括箭头样式、文本框样式等。
4. 添加文本框
文本框是一种特殊的文本容器,可以用来在图表中添加较长的说明文字。
4.1 使用text()函数添加文本框
我们可以使用text()函数并设置bbox参数来创建文本框:
import matplotlib.pyplot as plt

fig, ax = plt.subplots()
ax.plot([1, 2, 3, 4], [1, 4, 2, 3])
ax.text(0.5, 0.95, 'Text Box Example - how2matplotlib.com',
        transform=ax.transAxes, fontsize=12,
        verticalalignment='top', bbox=dict(boxstyle='round', facecolor='wheat', alpha=0.5))
plt.show()
Output:
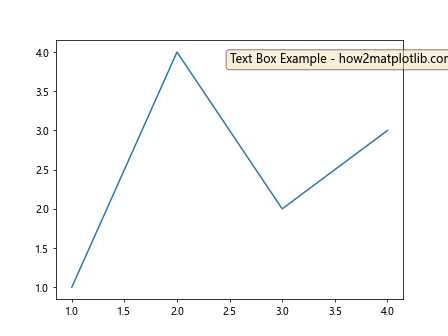
在这个例子中,transform=ax.transAxes参数使得文本位置以轴的比例来定位,而不是数据坐标。
4.2 使用AnchoredText
AnchoredText类提供了一种更灵活的方式来添加文本框:
import matplotlib.pyplot as plt
from matplotlib.offsetbox import AnchoredText

fig, ax = plt.subplots()
ax.plot([1, 2, 3, 4], [1, 4, 2, 3])
anchored_text = AnchoredText("AnchoredText Example - how2matplotlib.com", loc=2, frameon=True)
ax.add_artist(anchored_text)
plt.show()
Output:
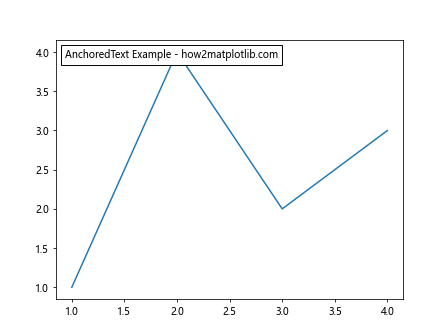
在这个例子中,loc=2表示文本框位于左上角,frameon=True表示显示文本框的边框。
5. 在多子图中添加文本
当我们创建包含多个子图的图表时,可以为每个子图单独添加文本,也可以为整个图表添加全局文本。
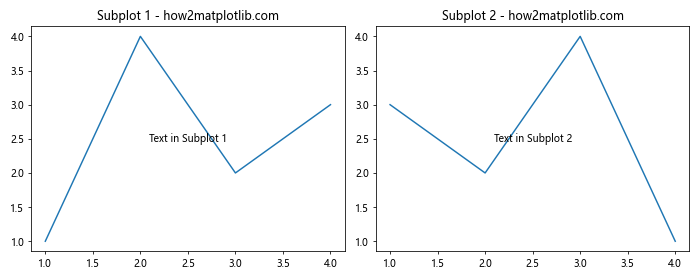
5.1 为每个子图添加文本
import matplotlib.pyplot as plt

fig, (ax1, ax2) = plt.subplots(1, 2, figsize=(10, 4))
ax1.plot([1, 2, 3, 4], [1, 4, 2, 3])
ax2.plot([1, 2, 3, 4], [3, 2, 4, 1])

ax1.set_title('Subplot 1 - how2matplotlib.com')
ax2.set_title('Subplot 2 - how2matplotlib.com')

ax1.text(0.5, 0.5, 'Text in Subplot 1', ha='center', va='center', transform=ax1.transAxes)
ax2.text(0.5, 0.5, 'Text in Subplot 2', ha='center', va='center', transform=ax2.transAxes)

plt.tight_layout()
plt.show()
Output:
5.2 添加全局文本
我们可以使用fig.text()方法为整个图表添加全局文本:
import matplotlib.pyplot as plt

fig, (ax1, ax2) = plt.subplots(1, 2, figsize=(10, 4))
ax1.plot([1, 2, 3, 4], [1, 4, 2, 3])
ax2.plot([1, 2, 3, 4], [3, 2, 4, 1])

fig.suptitle('Global Title - how2matplotlib.com', fontsize=16)
fig.text(0.5, 0.02, 'Global X-axis Label - how2matplotlib.com', ha='center')
fig.text(0.02, 0.5, 'Global Y-axis Label - how2matplotlib.com', va='center', rotation='vertical')

plt.tight_layout()
plt.show()
Output:
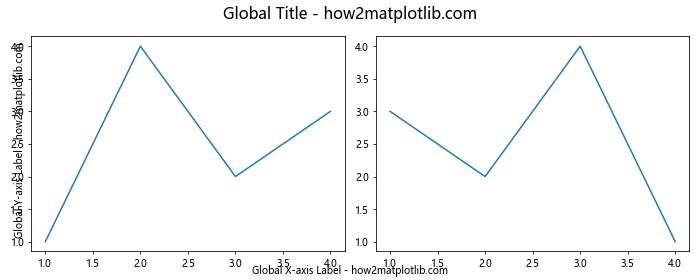
在这个例子中,fig.suptitle()用于添加全局标题,fig.text()用于添加全局x轴和y轴标签。
6. 使用LaTeX格式的文本
Matplotlib支持使用LaTeX格式来渲染数学公式和特殊符号。
6.1 基本LaTeX文本
import matplotlib.pyplot as plt

fig, ax = plt.subplots()
ax.text(0.5, 0.5, r'\alpha>\beta - how2matplotlib.com', fontsize=20)
ax.set_xlim(0, 1)
ax.set_ylim(0, 1)
plt.show()
Output:
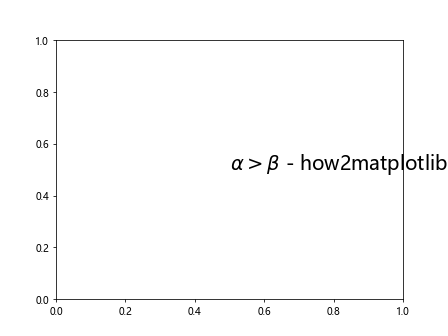
在这个例子中,我们使用了原始字符串(前缀r)来避免反斜杠被转义,并用美元符号$包围LaTeX公式。
6.2 复杂的LaTeX公式
import matplotlib.pyplot as plt

fig, ax = plt.subplots()
ax.text(0.5, 0.5, r'E=mc^2 \quad \int_{0}^{\infty} e^{-x^2} dx = \frac{\sqrt{\pi}}{2} - how2matplotlib.com',
        fontsize=16, ha='center', va='center')
ax.set_xlim(0, 1)
ax.set_ylim(0, 1)
plt.show()
Output:
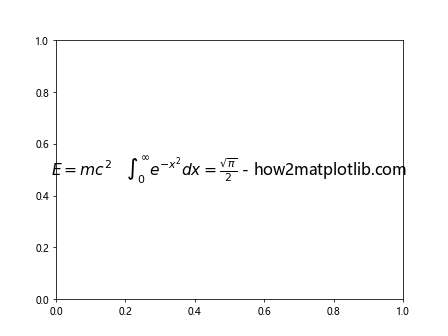
这个例子展示了如何在Matplotlib中使用更复杂的LaTeX公式。
7. 文本对齐和定位
正确的文本对齐和定位可以大大提高图表的可读性和美观度。
7.1 使用对齐参数
import matplotlib.pyplot as plt

fig, ax = plt.subplots()
ax.set_xlim(0, 10)
ax.set_ylim(0, 10)

ax.text(5, 5, 'Center - how2matplotlib.com', ha='center', va='center')
ax.text(0, 10, 'Top Left - how2matplotlib.com', ha='left', va='top')
ax.text(10, 0, 'Bottom Right - how2matplotlib.com', ha='right', va='bottom')

plt.show()
Output:
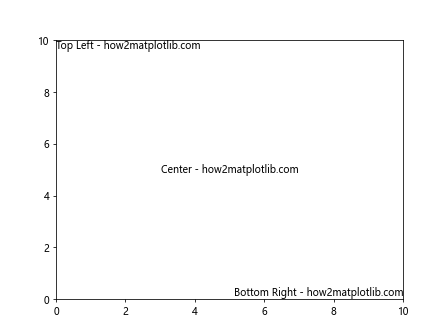
在这个例子中,我们使用ha(水平对齐)和va(垂直对齐)参数来控制文本的对齐方式。
7.2 使用transform参数
transform参数允许我们在不同的坐标系中定位文本:
import matplotlib.pyplot as plt

fig, ax = plt.subplots()
ax.plot([0, 1], [0, 1])

# 数据坐标
ax.text(0.5, 0.5, 'Data coords - how2matplotlib.com', transform=ax.transData)

# 轴坐标
ax.text(0.5, 0.5, 'Axes coords - how2matplotlib.com', transform=ax.transAxes)

# 图表坐标
fig.text(0.5, 0.5, 'Figure coords - how2matplotlib.com', transform=fig.transFigure)

plt.show()
Output:
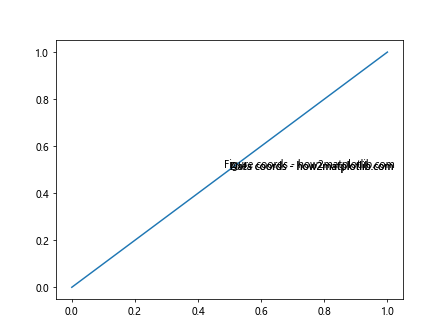
这个例子展示了如何在数据坐标、轴坐标和图表坐标系中定位文本。
8. 文本样式和格式化
Matplotlib提供了多种方式来自定义文本的样式和格式。
8.1 使用字体属性
import matplotlib.pyplot as plt

fig, ax = plt.subplots()
ax.text(0.5, 0.5, 'Custom Font - how2matplotlib.com',
        fontfamily='serif', fontweight='bold', fontstyle='italic', fontsize=16,
        ha='center', va='center')
ax.set_xlim(0, 1)
ax.set_ylim(0, 1)
plt.show()
Output:
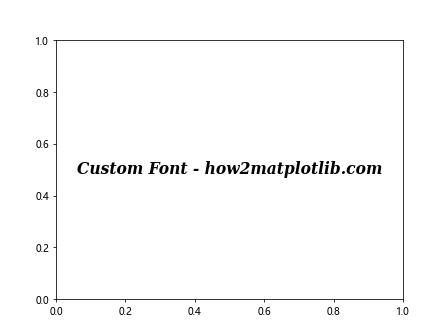
这个例子展示了如何设置文本的字体系列、粗细、样式和大小。
8.2 使用颜色和透明度
import matplotlib.pyplot as plt

fig, ax = plt.subplots()
ax.text(0.5, 0.7, 'Colored Text - how2matplotlib.com', color='red', alpha=0.7, ha='center')
ax.text(0.5, 0.3, 'Gradient Text - how2matplotlib.com',
        bbox=dict(facecolor='none', edgecolor='blue', alpha=0.5),
        ha='center')
ax.set_xlim(0, 1)
ax.set_ylim(0, 1)
plt.show()
Output:
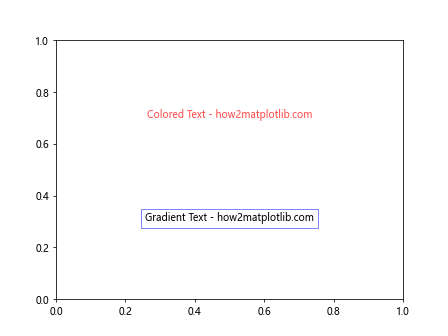
这个例子展示了如何设置文本颜色和透明度,以及如何为文本添加带有渐变效果的背景框。
9. 动态文本和格式化字符串
在某些情况下,我们可能需要根据数据动态生成文本内容。Matplotlib支持使用格式化字符串来实现这一点。
9.1 使用f-strings
import matplotlib.pyplot as plt
import numpy as np

x = np.linspace(0, 2*np.pi, 100)
y = np.sin(x)

fig, ax = plt.subplots()
ax.plot(x, y)

max_y = y.max()
max_x = x[np.argmax(y)]

ax.text(max_x, max_y, f'Max: ({max_x:.2f}, {max_y:.2f}) - how2matplotlib.com',
        ha='right', va='bottom')

plt.show()
Output:
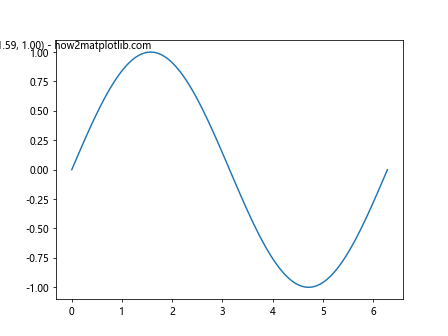
在这个例子中,我们使用f-strings来动态生成包含最大值坐标的文本。
9.2 使用format方法
import matplotlib.pyplot as plt
import numpy as np

data = np.random.randn(1000)

fig, ax = plt.subplots()
ax.hist(data, bins=30)

mean = data.mean()
std = data.std()

ax.text(0.05, 0.95, 'Mean: {:.2f}\nStd: {:.2f}\nhow2matplotlib.com'.format(mean, std),
        transform=ax.transAxes, va='top')

plt.show()
Output:
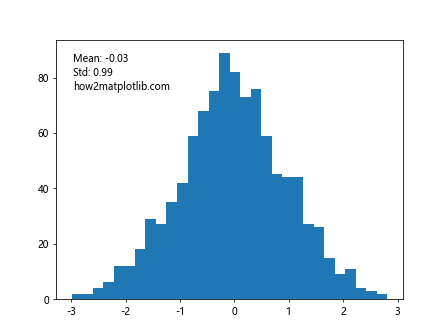
这个例子展示了如何使用format方法来格式化包含统计信息的文本。
10. 文本动画
Matplotlib还支持创建文本动画,这在制作交互式或动态图表时非常有用。
10.1 简单文本动画
import matplotlib.pyplot as plt
import matplotlib.animation as animation

fig, ax = plt.subplots()

text = ax.text(0.5, 0.5, '', ha='center', va='center')

def animate(frame):
    text.set_text(f'Frame {frame} - how2matplotlib.com')
    return text,

ani = animation.FuncAnimation(fig, animate, frames=range(60), interval=50)
plt.show()
Output:
这个例子创建了一个简单的文本动画,文本内容随着帧数变化而更新。
10.2 带有数据的文本动画
import matplotlib.pyplot as plt
import matplotlib.animation as animation
import numpy as np

fig, ax = plt.subplots()

x = np.linspace(0, 2*np.pi, 100)
line, = ax.plot(x, np.sin(x))
text = ax.text(0.02, 0.95, '', transform=ax.transAxes)

def animate(frame):
    y = np.sin(x + frame/10)
    line.set_ydata(y)
    text.set_text(f'Max value: {y.max():.2f}\nhow2matplotlib.com')
    return line, text

ani = animation.FuncAnimation(fig, animate, frames=range(60), interval=50)
plt.show()
Output:
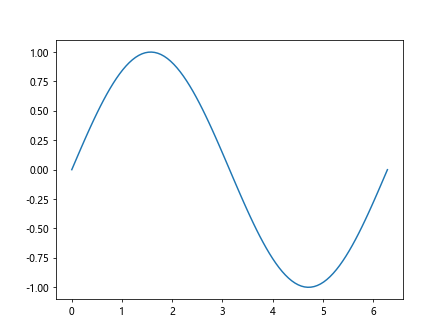
这个例子展示了如何创建一个包含动态数据和文本的动画。
11. 多语言文本支持
Matplotlib支持多种语言的文本渲染,包括非拉丁字符。
11.1 使用Unicode字符
import matplotlib.pyplot as plt

fig, ax = plt.subplots()
ax.text(0.5, 0.7, '你好,世界!- how2matplotlib.com', ha='center', fontsize=16)
ax.text(0.5, 0.3, 'こんにちは、世界!- how2matplotlib.com', ha='center', fontsize=16)
ax.set_xlim(0, 1)
ax.set_ylim(0, 1)
plt.show()
Output:
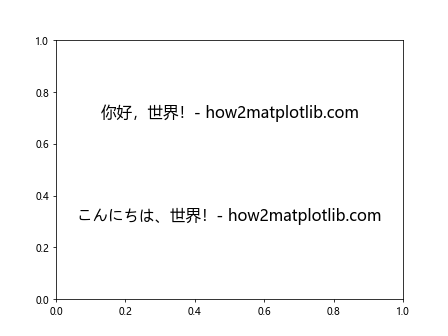
这个例子展示了如何在Matplotlib中使用中文和日文文本。
11.2 设置全局字体
对于某些语言,可能需要设置特定的字体才能正确显示:
import matplotlib.pyplot as plt
import matplotlib.font_manager as fm

# 设置全局字体
plt.rcParams['font.sans-serif'] = ['SimHei']  # 用来正常显示中文标签
plt.rcParams['axes.unicode_minus'] = False  # 用来正常显示负号

fig, ax = plt.subplots()
ax.set_title('中文标题 - how2matplotlib.com')
ax.text(0.5, 0.5, '这是一段中文文本 - how2matplotlib.com', ha='center', va='center')
ax.set_xlim(0, 1)
ax.set_ylim(0, 1)
plt.show()
Output:
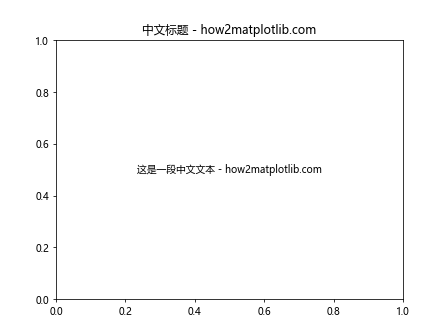
这个例子展示了如何设置全局字体以支持中文文本。
12. 文本效果
Matplotlib提供了多种方法来增强文本的视觉效果。
12.1 文本阴影
import matplotlib.pyplot as plt
import matplotlib.patheffects as path_effects

fig, ax = plt.subplots()
text = ax.text(0.5, 0.5, 'Shadow Effect - how2matplotlib.com', ha='center', va='center', fontsize=20)
text.set_path_effects([path_effects.withStroke(linewidth=5, foreground='gray')])
ax.set_xlim(0, 1)
ax.set_ylim(0, 1)
plt.show()
Output:
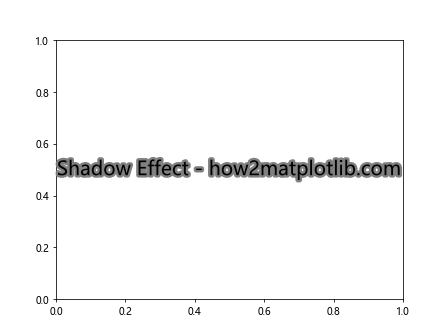
这个例子展示了如何为文本添加阴影效果。
12.2 文本轮廓
import matplotlib.pyplot as plt
import matplotlib.patheffects as path_effects

fig, ax = plt.subplots()
text = ax.text(0.5, 0.5, 'Outline Effect - how2matplotlib.com', ha='center', va='center', fontsize=20)
text.set_path_effects([path_effects.Stroke(linewidth=3, foreground='black'),
                       path_effects.Normal()])
ax.set_xlim(0, 1)
ax.set_ylim(0, 1)
plt.show()
Output:
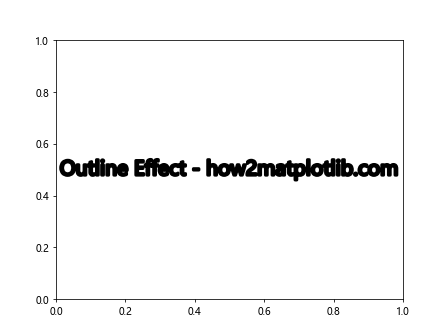
这个例子展示了如何为文本添加轮廓效果。
13. 文本与其他图形元素的交互
文本可以与图表中的其他元素进行交互,以创建更丰富的可视化效果。
13.1 文本与线条的交互
import matplotlib.pyplot as plt
import numpy as np

x = np.linspace(0, 10, 100)
y = np.sin(x)

fig, ax = plt.subplots()
line, = ax.plot(x, y)

ax.text(5, 0, 'Sine Wave - how2matplotlib.com', ha='center', va='center',
        bbox=dict(facecolor='white', edgecolor='none', alpha=0.7))

plt.show()
Output:
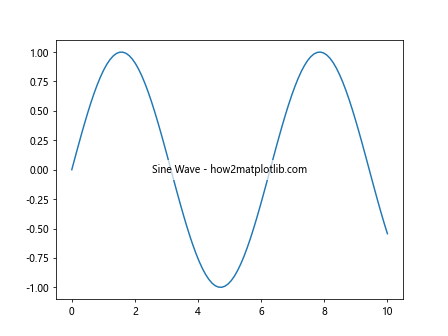
这个例子展示了如何在绘制的线条上添加说明文本。
13.2 文本与填充区域的交互
import matplotlib.pyplot as plt
import numpy as np

x = np.linspace(0, 10, 100)
y1 = np.sin(x)
y2 = np.cos(x)

fig, ax = plt.subplots()
ax.fill_between(x, y1, y2, alpha=0.3)
ax.text(5, 0, 'Filled Area - how2matplotlib.com', ha='center', va='center',
        bbox=dict(facecolor='white', edgecolor='none', alpha=0.7))

plt.show()
Output:
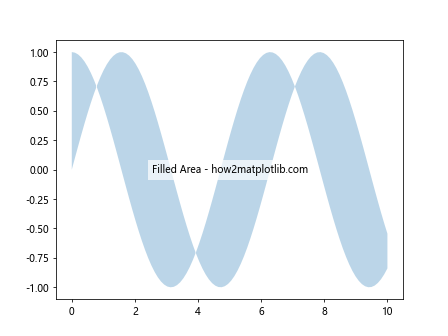
这个例子展示了如何在填充区域中添加说明文本。
14. 文本换行和多行文本
处理长文本或多行文本是数据可视化中的常见需求。
14.1 使用换行符
import matplotlib.pyplot as plt

fig, ax = plt.subplots()
ax.text(0.5, 0.5, 'Line 1\nLine 2\nLine 3\nhow2matplotlib.com',
        ha='center', va='center', fontsize=12)
ax.set_xlim(0, 1)
ax.set_ylim(0, 1)
plt.show()
Output:
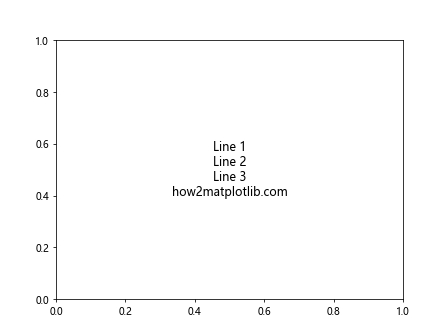
这个例子展示了如何使用换行符\n来创建多行文本。
14.2 使用textwrap模块
对于更长的文本,我们可以使用textwrap模块来自动换行:
import matplotlib.pyplot as plt
import textwrap

fig, ax = plt.subplots()
long_text = "This is a very long text that needs to be wrapped. It will be automatically split into multiple lines. how2matplotlib.com"
wrapped_text = textwrap.fill(long_text, width=30)
ax.text(0.5, 0.5, wrapped_text, ha='center', va='center', fontsize=10)
ax.set_xlim(0, 1)
ax.set_ylim(0, 1)
plt.show()
Output:
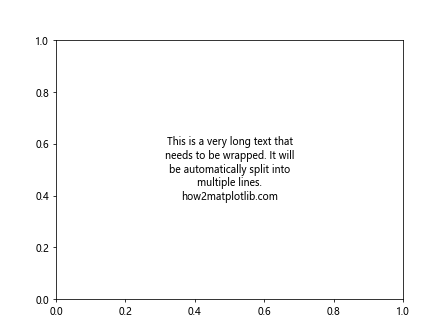
这个例子使用textwrap.fill()函数来自动将长文本分割成多行。
15. 文本与交互式图表
在创建交互式图表时,动态更新文本内容是一个常见需求。
15.1 使用鼠标事件更新文本
import matplotlib.pyplot as plt
import numpy as np

fig, ax = plt.subplots()
x = np.linspace(0, 10, 100)
y = np.sin(x)
line, = ax.plot(x, y)

text = ax.text(0.5, 1.05, '', transform=ax.transAxes, ha='center')

def update_text(event):
    if event.inaxes == ax:
        text.set_text(f'x={event.xdata:.2f}, y={event.ydata:.2f}\nhow2matplotlib.com')
    else:
        text.set_text('')
    fig.canvas.draw_idle()

fig.canvas.mpl_connect('motion_notify_event', update_text)
plt.show()
Output:
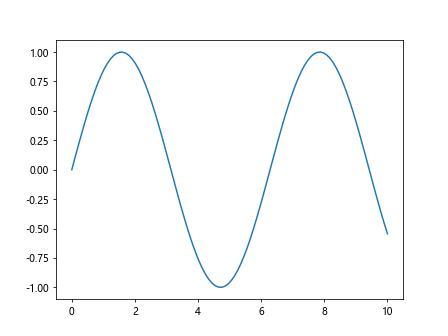
这个例子展示了如何使用鼠标事件来动态更新文本内容。
15.2 使用滑块更新文本
import matplotlib.pyplot as plt
from matplotlib.widgets import Slider
import numpy as np

fig, ax = plt.subplots()
plt.subplots_adjust(bottom=0.25)

t = np.linspace(0, 1, 1000)
a0 = 5
f0 = 3
s = a0 * np.sin(2 * np.pi * f0 * t)
l, = plt.plot(t, s, lw=2)

ax_freq = plt.axes([0.25, 0.1, 0.65, 0.03])
freq_slider = Slider(ax_freq, 'Freq', 0.1, 30.0, valinit=f0)

text = ax.text(0.02, 0.95, '', transform=ax.transAxes)

def update(val):
    f = freq_slider.val
    l.set_ydata(a0 * np.sin(2 * np.pi * f * t))
    text.set_text(f'Frequency: {f:.2f} Hz\nhow2matplotlib.com')
    fig.canvas.draw_idle()

freq_slider.on_changed(update)
plt.show()
Output:
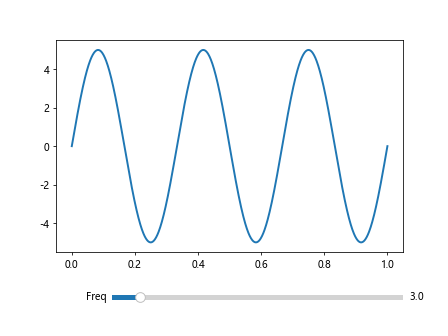
这个例子展示了如何使用滑块来动态更新图表和文本内容。
结论
在本文中,我们全面探讨了如何在Matplotlib中添加和操作文本。从基本的文本添加到高级的文本效果和动画,我们涵盖了广泛的主题。文本是数据可视化中不可或缺的元素,它可以帮助我们更好地解释数据,标注重要信息,并增强图表的整体可读性。
通过掌握这些技巧,你可以创建更加丰富、信息量更大的图表。记住,好的数据可视化不仅仅是展示数据,还包括有效地传达数据背后的故事。适当地使用文本可以大大提高你的图表的表现力和说服力。
在实际应用中,建议根据具体需求选择合适的文本添加方法,并注意文本的位置、大小和样式,以确保它们不会干扰图表的主要内容,而是能够恰到好处地补充和解释数据。同时,也要考虑到图表的整体美观性和一致性。
最后,随着Matplotlib的不断发展,可能会有新的文本处理功能被添加进来。因此,建议定期查看Matplotlib的官方文档,以了解最新的功能和最佳实践。通过不断学习和实践,你将能够创建出更加专业和吸引人的数据可视化作品。
 极客教程
极客教程