如何在Matplotlib中添加次要刻度
参考:how to add minor ticks in matplotlib
Matplotlib是一个用于绘制数据可视化图形的强大库,可以创建各种类型的图表,包括折线图、散点图、柱状图等。在绘制图表时,通常会设置主要刻度来标记轴上的数值,但有时需要添加次要刻度来更精细地展示数据。本文将介绍如何在Matplotlib中添加次要刻度。
1. 添加次要刻度到坐标轴
要添加次要刻度到Matplotlib的图表中,可以使用set_minor_locator方法来设置次要刻度定位器。下面是一个示例代码:
import matplotlib.pyplot as plt
import matplotlib.ticker as ticker

fig, ax = plt.subplots()

# 设置x轴次要刻度定位器
ax.xaxis.set_minor_locator(ticker.AutoMinorLocator())

plt.show()
Output:
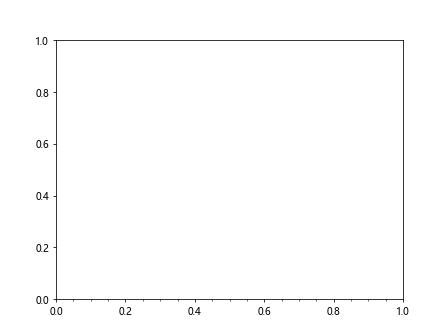
在上面的示例中,我们创建了一个图表,并设置了x轴的次要刻度定位器为自动次要刻度,这将根据数据范围自动添加次要刻度。可以通过AutoMinorLocator类来实现这一功能。接下来我们将介绍如何手动设置次要刻度。
2. 手动设置次要刻度
有时候需要手动设置次要刻度,可以通过MultipleLocator类来实现。下面是一个示例代码:
import matplotlib.pyplot as plt
import matplotlib.ticker as ticker

fig, ax = plt.subplots()

# 设置x轴次要刻度为每0.5单位
ax.xaxis.set_minor_locator(ticker.MultipleLocator(0.5))

plt.show()
Output:
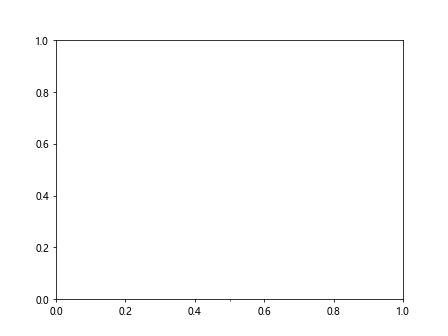
在上面的示例中,我们手动设置了x轴的次要刻度为每0.5单位,这样可以更精细地展示数据。
3. 设置次要刻度样式
可以通过MinorTickParams类来设置次要刻度的样式,包括刻度长度、宽度、颜色等。下面是一个示例代码:
import matplotlib.pyplot as plt

fig, ax = plt.subplots()

# 设置y轴次要刻度样式
ax.tick_params(which='minor', length=5, width=1, color='r')

plt.show()
Output:
在上面的示例中,我们设置了y轴次要刻度的长度为5,宽度为1,颜色为红色。
4. 多次要刻度
有时候需要在图表中同时显示多组次要刻度,可以通过MultipleLocator类和NullLocator类来实现。下面是一个示例代码:
import matplotlib.pyplot as plt
import matplotlib.ticker as ticker

fig, ax = plt.subplots()

# 设置x轴次要刻度为每0.5单位
ax.xaxis.set_minor_locator(ticker.MultipleLocator(0.5))
ax.yaxis.set_minor_locator(ticker.NullLocator())

plt.show()
Output:
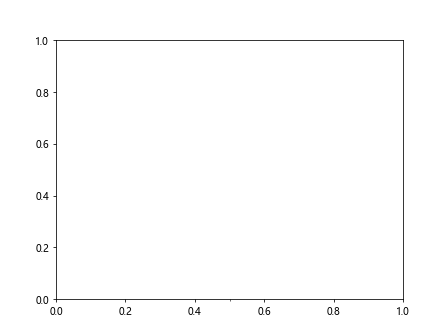
在上面的示例中,我们设置了x轴的次要刻度为每0.5单位,而y轴没有次要刻度显示。
5. 设置次要刻度位置
可以通过set_tick_params方法来设置次要刻度的位置。下面是一个示例代码:
import matplotlib.pyplot as plt

fig, ax = plt.subplots()

# 设置x轴次要刻度在上方
ax.tick_params(which='minor', direction='inout')

plt.show()
Output:
在上面的示例中,我们设置了x轴次要刻度的位置为上方,这将使次要刻度朝内外方向显示。
6. 设置次要刻度范围
可以通过set_xlim和set_ylim方法来设置次要刻度的范围。下面是一个示例代码:
import matplotlib.pyplot as plt

fig, ax = plt.subplots()

# 设置x轴次要刻度范围
ax.set_xlim(0, 10)
ax.set_ylim(0, 10)

plt.show()
Output:
在上面的示例中,我们设置了x轴和y轴次要刻度的范围为0到10。
7. 自定义次要刻度
有时候需要自定义次要刻度的位置和样式,可以通过FixedLocator类和FixedFormatter类来实现。下面是一个示例代码:
import matplotlib.pyplot as plt
import numpy as np
import matplotlib.ticker as ticker

fig, ax = plt.subplots()

# 自定义y轴次要刻度位置和样式
ax.yaxis.set_minor_locator(ticker.FixedLocator(np.arange(0, 10, 0.5)))
ax.yaxis.set_minor_formatter(ticker.FixedFormatter(['A', 'B', 'C', 'D', 'E', 'F', 'G', 'H', 'I', 'J']))

plt.show()
Output:
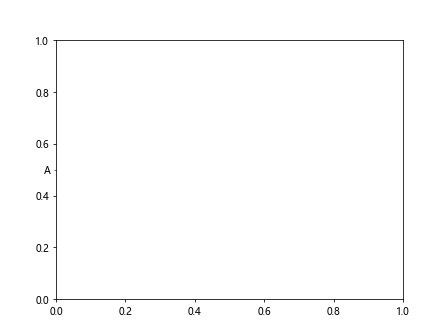
在上面的示例中,我们自定义了y轴次要刻度的位置和样式,每0.5单位一个刻度,对应字母A到J。
8. 移除次要刻度
有时候需要移除次要刻度,可以通过NullLocator类和NullFormatter类来实现。下面是一个示例代码:
import matplotlib.pyplot as plt
import matplotlib.ticker as ticker

fig, ax = plt.subplots()

# 移除y轴次要刻度
ax.yaxis.set_minor_locator(ticker.NullLocator())
ax.yaxis.set_minor_formatter(ticker.NullFormatter())

plt.show()
Output:
在上面的示例中,我们移除了y轴的次要刻度。
9. 设置次要刻度的间隔
可以通过AutoMinorLocator类来设置次要刻度的间隔。下面是一个示例代码:
import matplotlib.pyplot as plt
import matplotlib.ticker as ticker

fig, ax = plt.subplots()

# 设置x轴次要刻度的间隔为2
ax.xaxis.set_minor_locator(ticker.AutoMinorLocator(n=2))

plt.show()
Output:
在上面的示例中,我们设置了x轴次要刻度的间隔为2。
10. 使用次要刻度显示特定数据点
有时候需要在图表中显示特定的数据点,可以通过FixedLocator类来设置次要刻度。下面是一个示例代码:
import matplotlib.pyplot as plt
import numpy as np
import matplotlib.ticker as ticker

fig, ax = plt.subplots()

# 使用次要刻度显示特定数据点
ax.xaxis.set_minor_locator(ticker.FixedLocator([1, 3, 5, 7, 9]))
ax.yaxis.set_minor_formatter(ticker.FixedFormatter(['A', 'B', 'C', 'D', 'E']))

plt.show()
在上面的示例中,我们使用次要刻度显示了x轴和y轴特定的数据点。
总之,在Matplotlib中添加次要刻度可以帮助更精细地展示数据,通过本文介绍的方法,可以轻松地实现次要刻度的添加、样式设置和位置控制。希望本文对你理解如何在Matplotlib中添加次要刻度有所帮助。如果想要进一步探索Matplotlib的次要刻度功能,可以查阅Matplotlib官方文档或者参考其他的教程和案例。
结语
本文详细介绍了如何在Matplotlib中添加次要刻度,包括设置次要刻度定位器、手动设置次要刻度、修改次要刻度样式、显示多组次要刻度、设置次要刻度位置、范围、自定义刻度、移除次要刻度、设置刻度间隔等方面的方法。通过这些技巧,可以让你更灵活地控制图表的次要刻度,从而更好地展示数据和提升图表的可视化效果。
 极客教程
极客教程