Matplotlib fmt errorbar
参考:fmt errorbar
在matplotlib中,我们经常会用到errorbar函数来展示数据的误差范围。在绘制errorbar时,我们可以指定不同的fmt参数来控制误差线的样式。本文将详细介绍fmt参数的不同设置方式以及效果展示。
使用fmt参数设置误差线样式
在matplotlib的errorbar函数中,我们可以通过设置fmt参数来控制误差线的样式。fmt参数是一个字符串,其中包含了控制线条风格和颜色的方式。下面我们将展示一些常用的fmt参数设置方式。
实线
import matplotlib.pyplot as plt

x = [1, 2, 3, 4, 5]
y = [1, 4, 9, 16, 25]
errors = [0.1, 0.2, 0.3, 0.4, 0.5]

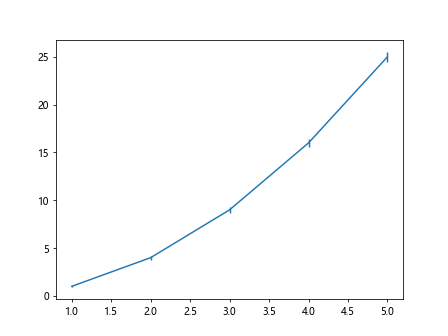
plt.errorbar(x, y, yerr=errors, fmt='-')
plt.show()
Output:
虚线
import matplotlib.pyplot as plt

x = [1, 2, 3, 4, 5]
y = [1, 4, 9, 16, 25]
errors = [0.1, 0.2, 0.3, 0.4, 0.5]

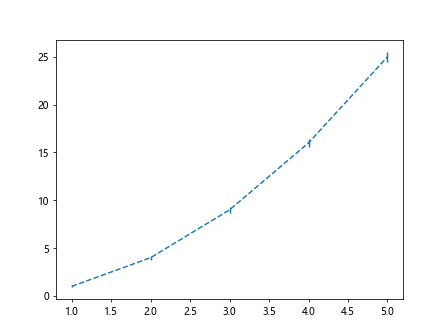
plt.errorbar(x, y, yerr=errors, fmt='--')
plt.show()
Output:
点线
import matplotlib.pyplot as plt

x = [1, 2, 3, 4, 5]
y = [1, 4, 9, 16, 25]
errors = [0.1, 0.2, 0.3, 0.4, 0.5]

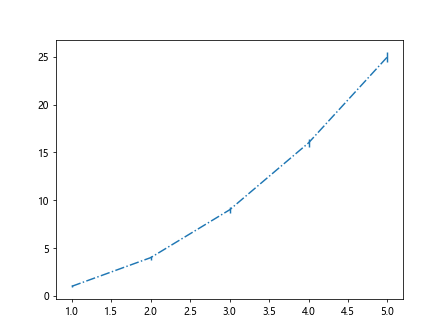
plt.errorbar(x, y, yerr=errors, fmt='-.')
plt.show()
Output:
方块点线
import matplotlib.pyplot as plt

x = [1, 2, 3, 4, 5]
y = [1, 4, 9, 16, 25]
errors = [0.1, 0.2, 0.3, 0.4, 0.5]

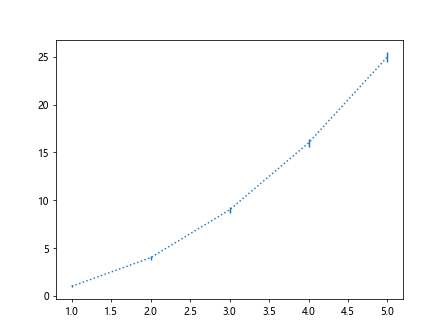
plt.errorbar(x, y, yerr=errors, fmt=':')
plt.show()
Output:
等间距点线
import matplotlib.pyplot as plt

x = [1, 2, 3, 4, 5]
y = [1, 4, 9, 16, 25]
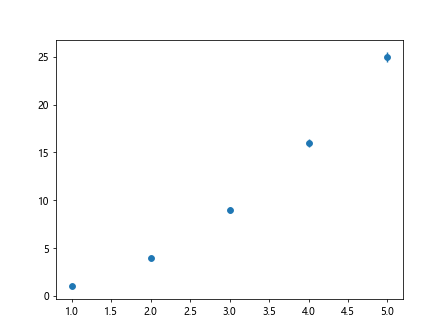
errors = [0.1, 0.2, 0.3, 0.4, 0.5]

plt.errorbar(x, y, yerr=errors, fmt='o')
plt.show()
Output:
圆形点线
import matplotlib.pyplot as plt

x = [1, 2, 3, 4, 5]
y = [1, 4, 9, 16, 25]
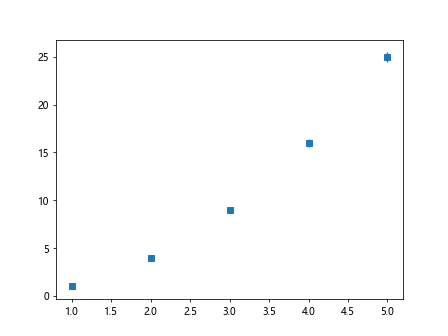
errors = [0.1, 0.2, 0.3, 0.4, 0.5]

plt.errorbar(x, y, yerr=errors, fmt='s')
plt.show()
Output:
下三角点线
import matplotlib.pyplot as plt

x = [1, 2, 3, 4, 5]
y = [1, 4, 9, 16, 25]
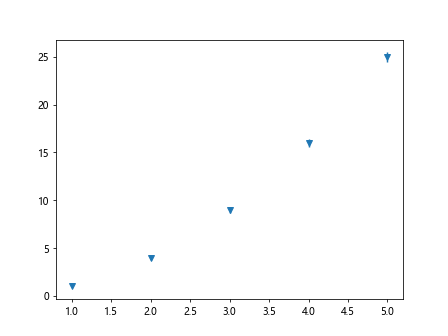
errors = [0.1, 0.2, 0.3, 0.4, 0.5]

plt.errorbar(x, y, yerr=errors, fmt='v')
plt.show()
Output:
上三角点线
import matplotlib.pyplot as plt

x = [1, 2, 3, 4, 5]
y = [1, 4, 9, 16, 25]
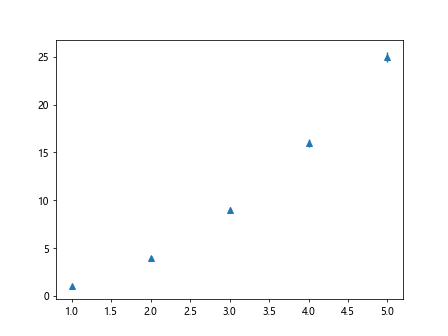
errors = [0.1, 0.2, 0.3, 0.4, 0.5]

plt.errorbar(x, y, yerr=errors, fmt='^')
plt.show()
Output:
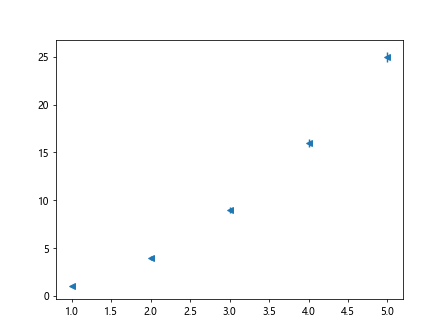
左三角点线
import matplotlib.pyplot as plt

x = [1, 2, 3, 4, 5]
y = [1, 4, 9, 16, 25]
errors = [0.1, 0.2, 0.3, 0.4, 0.5]

plt.errorbar(x, y, yerr=errors, fmt='<')
plt.show()
Output:
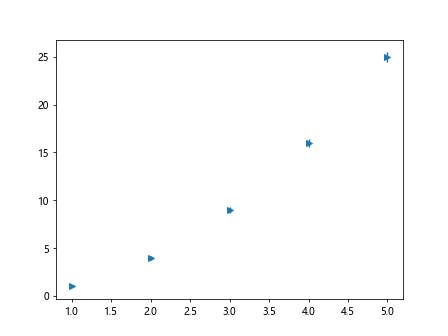
右三角点线
import matplotlib.pyplot as plt

x = [1, 2, 3, 4, 5]
y = [1, 4, 9, 16, 25]
errors = [0.1, 0.2, 0.3, 0.4, 0.5]

plt.errorbar(x, y, yerr=errors, fmt='>')
plt.show()
Output:
图例设置
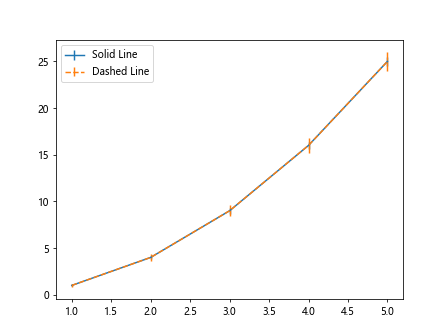
当我们使用不同的fmt参数设置误差线样式时,可以通过legend函数来设置图例。
import matplotlib.pyplot as plt

x = [1, 2, 3, 4, 5]
y = [1, 4, 9, 16, 25]
errors = [0.1, 0.2, 0.3, 0.4, 0.5]

plt.errorbar(x, y, yerr=errors, fmt='-', label='Solid Line')
plt.errorbar(x, [i**2 for i in x], yerr=[e*2 for e in errors], fmt='--', label='Dashed Line')
plt.legend()
plt.show()
Output:
颜色设置
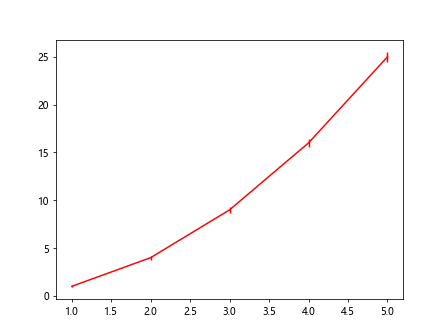
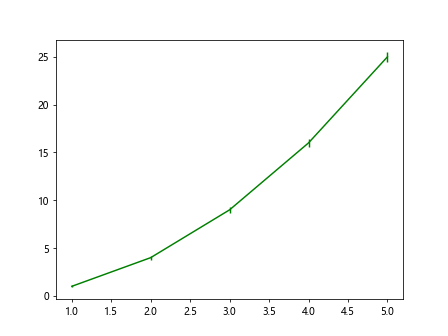
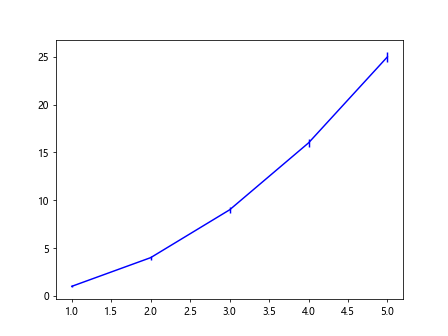
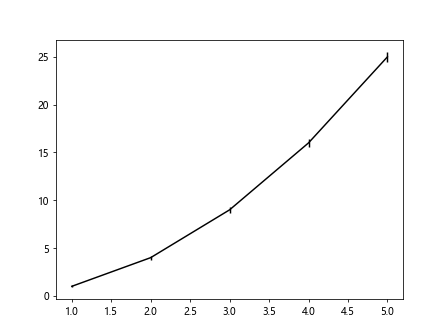
除了线条样式,我们还可以通过fmt参数来设置误差线的颜色。
import matplotlib.pyplot as plt

x = [1, 2, 3, 4, 5]
y = [1, 4, 9, 16, 25]
errors = [0.1, 0.2, 0.3, 0.4, 0.5]

plt.errorbar(x, y, yerr=errors, fmt='r-')
plt.show()
Output:
import matplotlib.pyplot as plt

x = [1, 2, 3, 4, 5]
y = [1, 4, 9, 16, 25]
errors = [0.1, 0.2, 0.3, 0.4, 0.5]

plt.errorbar(x, y, yerr=errors, fmt='g-')
plt.show()
Output:
import matplotlib.pyplot as plt

x = [1, 2, 3, 4, 5]
y = [1, 4, 9, 16, 25]
errors = [0.1, 0.2, 0.3, 0.4, 0.5]

plt.errorbar(x, y, yerr=errors, fmt='b-')
plt.show()
Output:
import matplotlib.pyplot as plt

x = [1, 2, 3, 4, 5]
y = [1, 4, 9, 16, 25]
errors = [0.1, 0.2, 0.3, 0.4, 0.5]

plt.errorbar(x, y, yerr=errors, fmt='k-')
plt.show()
Output:
组合设置
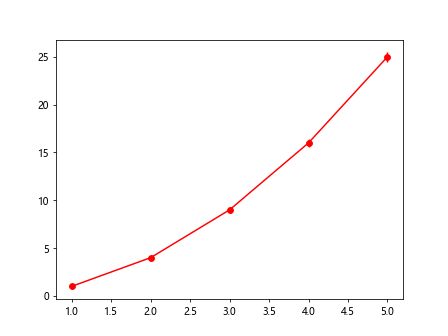
最后,我们也可以将线条样式和颜色进行组合设置。
import matplotlib.pyplot as plt

x = [1, 2, 3, 4, 5]
y = [1, 4, 9, 16, 25]
errors = [0.1, 0.2, 0.3, 0.4, 0.5]

plt.errorbar(x, y, yerr=errors, fmt='ro-')
plt.show()
Output:
import matplotlib.pyplot as plt

x = [1, 2, 3, 4, 5]
y = [1, 4, 9, 16, 25]
errors = [0.1, 0.2, 0.3, 0.4, 0.5]

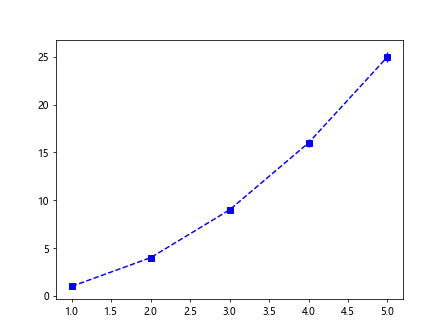
plt.errorbar(x, y, yerr=errors, fmt='bs--')
plt.show()
Output:
import matplotlib.pyplot as plt

x = [1, 2, 3, 4, 5]
y = [1, 4, 9, 16, 25]
errors = [0.1, 0.2, 0.3, 0.4, 0.5]

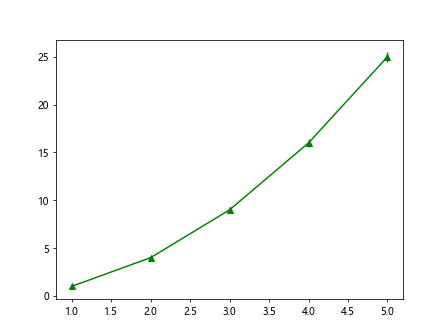
plt.errorbar(x, y, yerr=errors, fmt='g^-')
plt.show()
Output:
import matplotlib.pyplot as plt

x = [1, 2, 3, 4, 5]
y = [1, 4, 9, 16, 25]
errors = [0.1, 0.2, 0.3, 0.4, 0.5]

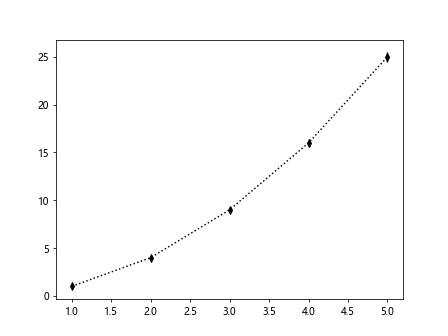
plt.errorbar(x, y, yerr=errors, fmt='kd:')
plt.show()
Output:
总结
通过本文的介绍,我们学习了在matplotlib中如何使用fmt参数来设置errorbar的样式,包括线条样式和颜色。在实际使用中,我们可以根据需要选择合适的fmt参数,使得误差线的展示更加清晰和美观。
 极客教程
极客教程