使用Matplotlib在Python中绘制非结构化三角网格等高线图
参考:Draw contours on an unstructured triangular grid in Python using Matplotlib
非结构化三角网格是一种常用于数值模拟和科学计算的网格类型。在这种网格上绘制等高线可以帮助我们直观地理解数据分布和变化趋势。本文将详细介绍如何使用Python的Matplotlib库在非结构化三角网格上绘制等高线图。我们将从基础概念开始,逐步深入到高级技巧,帮助读者全面掌握这一绘图技术。
1. 非结构化三角网格简介
非结构化三角网格是由不规则分布的点和连接这些点的三角形单元组成的网格。与结构化网格相比,非结构化网格具有更好的灵活性,可以更好地适应复杂的几何形状和边界条件。
1.1 非结构化三角网格的特点
- 灵活性:可以适应复杂的几何形状
- 局部加密:可以在感兴趣的区域增加网格密度
- 不规则性:节点分布和单元形状不规则
1.2 创建简单的非结构化三角网格
让我们从一个简单的例子开始,创建一个基本的非结构化三角网格:
import numpy as np
import matplotlib.pyplot as plt
from matplotlib.tri import Triangulation

# 创建随机点
np.random.seed(42)
x = np.random.rand(20)
y = np.random.rand(20)

# 创建三角剖分
tri = Triangulation(x, y)

# 绘制三角网格
plt.figure(figsize=(8, 6))
plt.triplot(tri, 'bo-')
plt.title('Simple Unstructured Triangular Grid - how2matplotlib.com')
plt.xlabel('X')
plt.ylabel('Y')
plt.show()
Output:
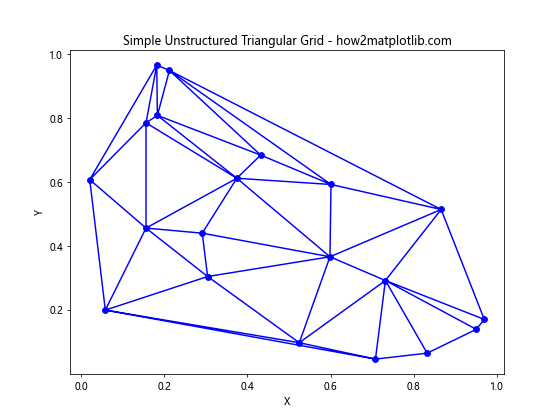
在这个例子中,我们首先生成了20个随机点,然后使用Matplotlib的Triangulation类创建了三角剖分。triplot函数用于绘制三角网格。这个简单的示例展示了非结构化三角网格的基本形态。
2. 准备数据
在绘制等高线之前,我们需要准备好网格点和对应的数据值。
2.1 生成网格点
我们可以使用NumPy生成一些随机点作为我们的网格点:
import numpy as np
import matplotlib.pyplot as plt
from matplotlib.tri import Triangulation

# 生成随机点
np.random.seed(42)
npoints = 200
x = np.random.uniform(-2, 2, npoints)
y = np.random.uniform(-2, 2, npoints)

# 创建三角剖分
triang = Triangulation(x, y)

# 绘制网格点
plt.figure(figsize=(8, 6))
plt.scatter(x, y, c='b', marker='o')
plt.title('Grid Points for Unstructured Triangular Grid - how2matplotlib.com')
plt.xlabel('X')
plt.ylabel('Y')
plt.show()
Output:
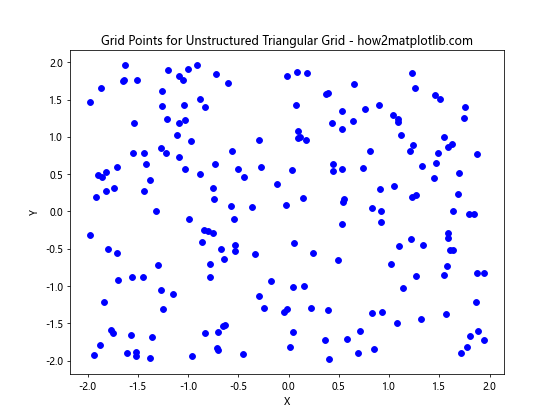
这段代码生成了200个随机分布在[-2, 2]x[-2, 2]区域内的点。我们使用scatter函数来可视化这些点的分布。
2.2 生成数据值
接下来,我们需要为每个网格点生成一个对应的数据值。这里我们可以使用一个简单的函数来生成这些值:
import numpy as np
import matplotlib.pyplot as plt
from matplotlib.tri import Triangulation

# 生成随机点
np.random.seed(42)
npoints = 200
x = np.random.uniform(-2, 2, npoints)
y = np.random.uniform(-2, 2, npoints)

# 生成数据值
z = x * np.exp(-x**2 - y**2)

# 创建三角剖分
triang = Triangulation(x, y)

# 绘制数据点
plt.figure(figsize=(8, 6))
plt.scatter(x, y, c=z, cmap='viridis')
plt.colorbar(label='Z Value')
plt.title('Data Points for Contour Plot - how2matplotlib.com')
plt.xlabel('X')
plt.ylabel('Y')
plt.show()
Output:
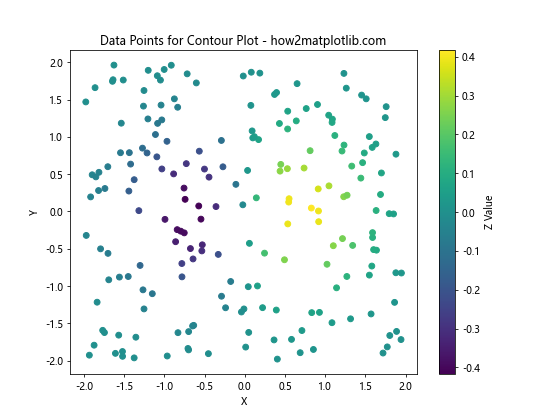
在这个例子中,我们使用函数 z = x * exp(-x^2 - y^2) 来生成数据值。这个函数会产生一些有趣的变化,适合用来绘制等高线。我们使用scatter函数来绘制这些点,并用颜色来表示z值的大小。
3. 绘制基本等高线图
现在我们有了网格点和对应的数据值,可以开始绘制等高线图了。
3.1 使用tricontour函数
Matplotlib提供了tricontour函数,专门用于在非结构化三角网格上绘制等高线:
import numpy as np
import matplotlib.pyplot as plt
from matplotlib.tri import Triangulation

# 生成数据
np.random.seed(42)
npoints = 200
x = np.random.uniform(-2, 2, npoints)
y = np.random.uniform(-2, 2, npoints)
z = x * np.exp(-x**2 - y**2)

# 创建三角剖分
triang = Triangulation(x, y)

# 绘制等高线
plt.figure(figsize=(10, 8))
contours = plt.tricontour(triang, z, levels=15, cmap='viridis')
plt.colorbar(contours, label='Z Value')
plt.title('Basic Contour Plot on Unstructured Grid - how2matplotlib.com')
plt.xlabel('X')
plt.ylabel('Y')
plt.show()
Output:
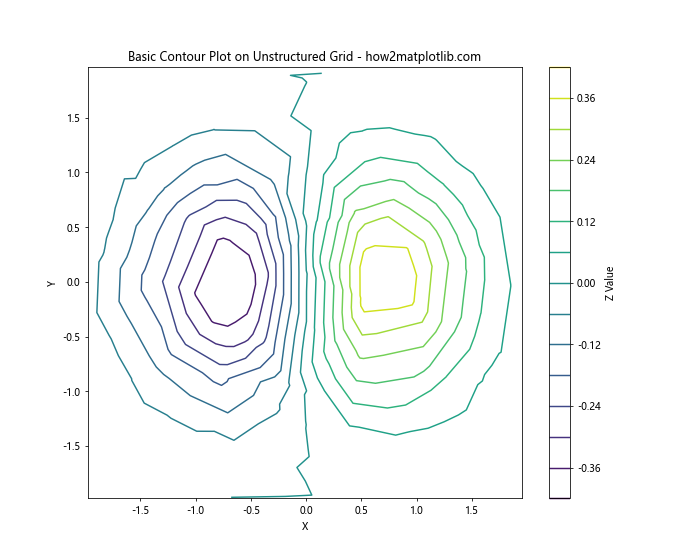
在这个例子中,我们使用tricontour函数绘制了15条等高线。levels参数控制等高线的数量,cmap参数设置颜色映射。
3.2 添加等高线标签
为了更好地理解等高线图,我们可以为等高线添加标签:
import numpy as np
import matplotlib.pyplot as plt
from matplotlib.tri import Triangulation

# 生成数据
np.random.seed(42)
npoints = 200
x = np.random.uniform(-2, 2, npoints)
y = np.random.uniform(-2, 2, npoints)
z = x * np.exp(-x**2 - y**2)

# 创建三角剖分
triang = Triangulation(x, y)

# 绘制等高线并添加标签
plt.figure(figsize=(10, 8))
contours = plt.tricontour(triang, z, levels=10, colors='k')
plt.clabel(contours, inline=True, fontsize=8, fmt='%.2f')
plt.title('Contour Plot with Labels - how2matplotlib.com')
plt.xlabel('X')
plt.ylabel('Y')
plt.show()
Output:
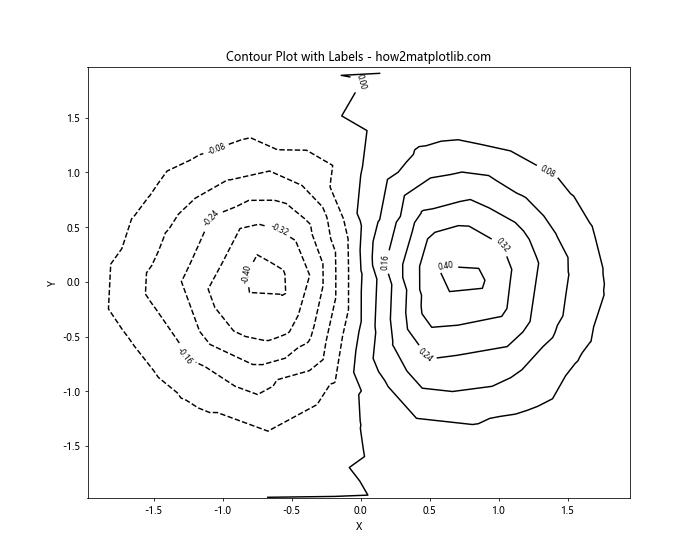
这里我们使用clabel函数为等高线添加标签。inline=True参数使标签绘制在等高线内部,fontsize设置字体大小,fmt参数控制标签的格式。
4. 填充等高线
除了线条等高线,我们还可以绘制填充的等高线图,这种图形通常被称为等高面图。
4.1 使用tricontourf函数
Matplotlib提供了tricontourf函数来绘制填充的等高线图:
import numpy as np
import matplotlib.pyplot as plt
from matplotlib.tri import Triangulation

# 生成数据
np.random.seed(42)
npoints = 200
x = np.random.uniform(-2, 2, npoints)
y = np.random.uniform(-2, 2, npoints)
z = x * np.exp(-x**2 - y**2)

# 创建三角剖分
triang = Triangulation(x, y)

# 绘制填充等高线图
plt.figure(figsize=(10, 8))
filled_contours = plt.tricontourf(triang, z, levels=15, cmap='viridis')
plt.colorbar(filled_contours, label='Z Value')
plt.title('Filled Contour Plot - how2matplotlib.com')
plt.xlabel('X')
plt.ylabel('Y')
plt.show()
Output:
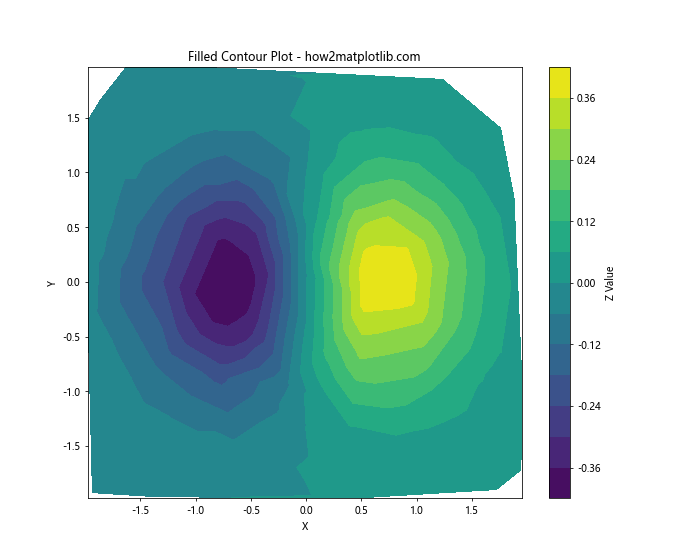
这个例子使用tricontourf函数创建了一个填充的等高线图。颜色的变化直观地展示了数据的变化趋势。
4.2 结合线条和填充等高线
我们可以将线条等高线和填充等高线结合起来,以获得更详细的可视化效果:
import numpy as np
import matplotlib.pyplot as plt
from matplotlib.tri import Triangulation

# 生成数据
np.random.seed(42)
npoints = 200
x = np.random.uniform(-2, 2, npoints)
y = np.random.uniform(-2, 2, npoints)
z = x * np.exp(-x**2 - y**2)

# 创建三角剖分
triang = Triangulation(x, y)

# 绘制填充等高线和线条等高线
plt.figure(figsize=(10, 8))
filled_contours = plt.tricontourf(triang, z, levels=15, cmap='viridis')
line_contours = plt.tricontour(triang, z, levels=15, colors='k', linewidths=0.5)
plt.clabel(line_contours, inline=True, fontsize=8, fmt='%.2f')
plt.colorbar(filled_contours, label='Z Value')
plt.title('Combined Filled and Line Contour Plot - how2matplotlib.com')
plt.xlabel('X')
plt.ylabel('Y')
plt.show()
Output:
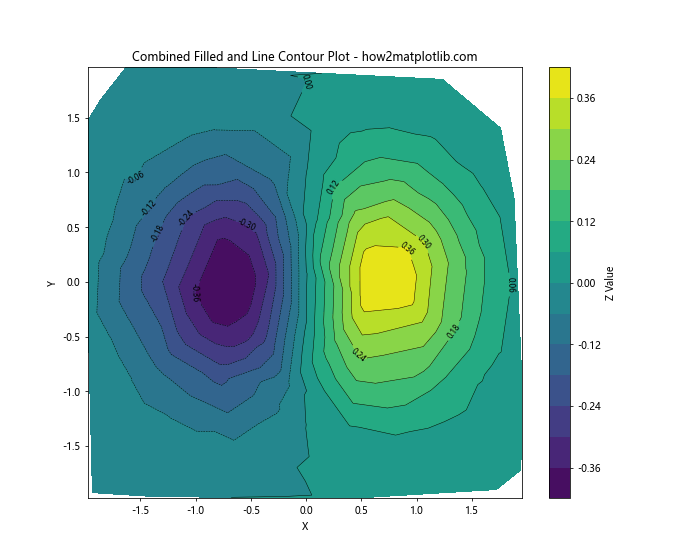
在这个例子中,我们首先使用tricontourf绘制填充等高线,然后使用tricontour在其上叠加线条等高线。这种组合可以同时展示数据的整体趋势和精确的等值线。
5. 自定义等高线
Matplotlib提供了多种方式来自定义等高线的外观,让我们来探索一些常用的自定义选项。
5.1 设置特定的等高线级别
我们可以通过设置levels参数来指定特定的等高线级别:
import numpy as np
import matplotlib.pyplot as plt
from matplotlib.tri import Triangulation

# 生成数据
np.random.seed(42)
npoints = 200
x = np.random.uniform(-2, 2, npoints)
y = np.random.uniform(-2, 2, npoints)
z = x * np.exp(-x**2 - y**2)

# 创建三角剖分
triang = Triangulation(x, y)

# 设置特定的等高线级别
levels = [-0.4, -0.2, 0, 0.2, 0.4]

# 绘制等高线
plt.figure(figsize=(10, 8))
contours = plt.tricontour(triang, z, levels=levels, colors='k')
plt.clabel(contours, inline=True, fontsize=8, fmt='%.2f')
plt.title('Contour Plot with Specific Levels - how2matplotlib.com')
plt.xlabel('X')
plt.ylabel('Y')
plt.show()
Output:
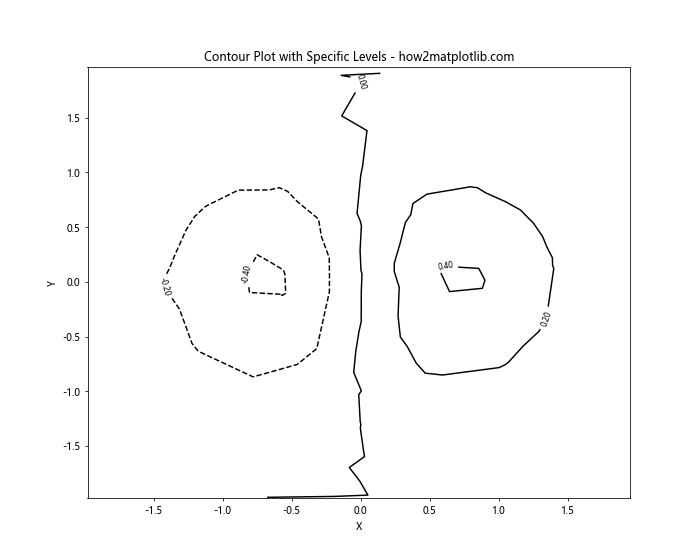
在这个例子中,我们指定了5个特定的等高线级别。这允许我们关注数据中的特定范围或值。
5.2 自定义等高线颜色
我们可以为每条等高线指定不同的颜色:
import numpy as np
import matplotlib.pyplot as plt
from matplotlib.tri import Triangulation

# 生成数据
np.random.seed(42)
npoints = 200
x = np.random.uniform(-2, 2, npoints)
y = np.random.uniform(-2, 2, npoints)
z = x * np.exp(-x**2 - y**2)

# 创建三角剖分
triang = Triangulation(x, y)

# 设置等高线级别和颜色
levels = [-0.4, -0.2, 0, 0.2, 0.4]
colors = ['blue', 'cyan', 'green', 'yellow', 'red']

# 绘制自定义颜色的等高线
plt.figure(figsize=(10, 8))
contours = plt.tricontour(triang, z, levels=levels, colors=colors)
plt.clabel(contours, inline=True, fontsize=8, fmt='%.2f')
plt.title('Contour Plot with Custom Colors - how2matplotlib.com')
plt.xlabel('X')
plt.ylabel('Y')
plt.show()
Output:
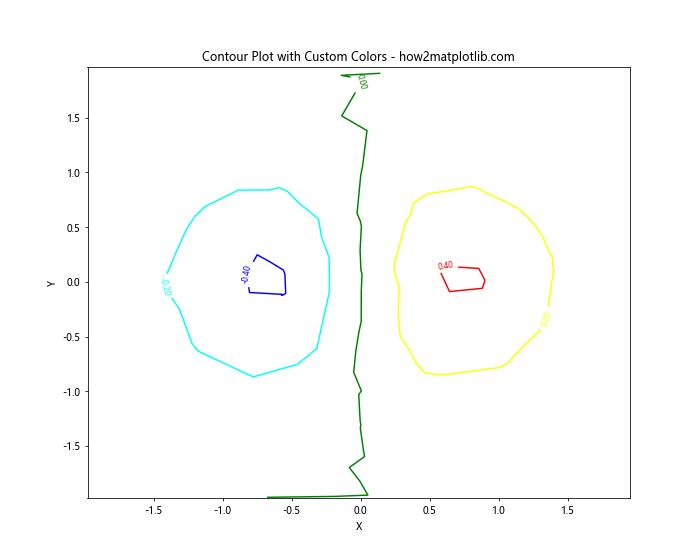
这个例子展示了如何为每个等高线级别指定不同的颜色,使得不同的数据范围更加容易区分。
6. 添加网格和数据点
为了更好地理解非结构化网格的结构,我们可以在等高线图上添加网格线和数据点。
6.1 显示三角网格
我们可以使用triplot函数来显示三角网格:
import numpy as np
import matplotlib.pyplot as plt
from matplotlib.tri import Triangulation

# 生成数据
np.random.seed(42)
npoints = 100
x = np.random.uniform(-2, 2, npoints)
y = np.random.uniform(-2, 2, npoints)
z = x * np.exp(-x**2 - y**2)

# 创建三角剖分
triang = Triangulation(x, y)

# 绘制等高线和三角网格
plt.figure(figsize=(10, 8))
contours = plt.tricontour(triang, z, levels=15, colors='k', linewidths=0.5)
plt.triplot(triang, 'r-', lw=0.5, alpha=0.5)
plt.clabel(contours, inline=True, fontsize=8, fmt='%.2f')
plt.title('Contour Plot with Triangular Grid - how2matplotlib.com')
plt.xlabel('X')
plt.ylabel('Y')
plt.show()
Output:

在这个例子中,我们使用triplot函数绘制了红色的三角网格,并设置了透明度为0.5,使其不会过于干扰等高线的显示。
6.2 添加数据点
我们还可以在图上显示原始的数据点:
import numpy as np
import matplotlib.pyplot as plt
from matplotlib.tri import Triangulation

# 生成数据
np.random.seed(42)
npoints = 100
x = np.random.uniform(-2, 2, npoints)
y = np.random.uniform(-2, 2, npoints)
z = x * np.exp(-x**2 - y**2)

# 创建三角剖分
triang = Triangulation(x, y)

# 绘制等高线、三角网格和数据点
plt.figure(figsize=(10, 8))
contours = plt.tricontour(triang, z, levels=15, colors='k', linewidths=0.5)
plt.triplot(triang, 'r-', lw=0.5, alpha=0.3)
plt.scatter(x, y, c='b', s=10, alpha=0.5)
plt.clabel(contours, inline=True, fontsize=8, fmt='%.2f')
plt.title('Contour Plot with Grid and Data Points - how2matplotlib.com')
plt.xlabel('X')
plt.ylabel('Y')
plt.show()
Output:
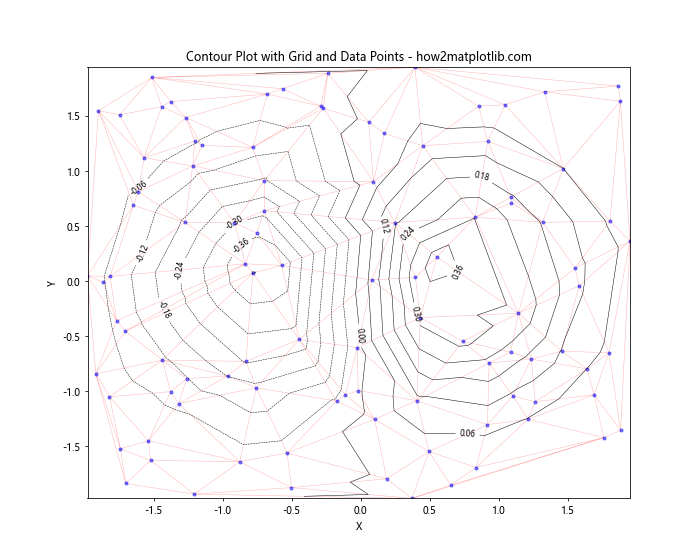
这个例子在等高线和三角网格的基础上,使用scatter函数添加了蓝色的数据点。这样可以直观地看到原始数据的分布。
7. 处理不规则边界
在实际应用中,我们可能会遇到具有不规则边界的数据。Matplotlib提供了一些工具来处理这种情况。
7.1 使用掩码
我们可以使用掩码来排除某些三角形,从而创建不规则边界:
import numpy as np
import matplotlib.pyplot as plt
from matplotlib.tri import Triangulation

# 生成数据
np.random.seed(42)
npoints = 200
x = np.random.uniform(-2, 2, npoints)
y = np.random.uniform(-2, 2, npoints)
z = x * np.exp(-x**2 - y**2)

# 创建三角剖分
triang = Triangulation(x, y)

# 创建掩码
mask = np.hypot(x[triang.triangles].mean(axis=1),
                y[triang.triangles].mean(axis=1)) < 1.4

triang.set_mask(mask)

# 绘制等高线
plt.figure(figsize=(10, 8))
contours = plt.tricontourf(triang, z, levels=15, cmap='viridis')
plt.triplot(triang, 'k-', lw=0.5, alpha=0.5)
plt.colorbar(contours, label='Z Value')
plt.title('Contour Plot with Irregular Boundary - how2matplotlib.com')
plt.xlabel('X')
plt.ylabel('Y')
plt.show()
Output:
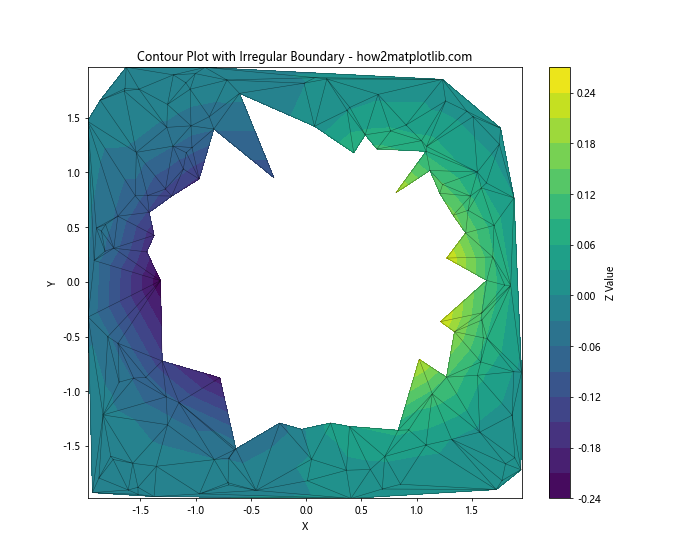
在这个例子中,我们创建了一个圆形的掩码,只显示半径小于1.4的区域。这种技术可以用来处理各种形状的不规则边界。
7.2 使用边界插值
对于更复杂的边界,我们可以使用边界插值技术:
import numpy as np
import matplotlib.pyplot as plt
from matplotlib.tri import Triangulation, UniformTriRefiner

# 生成数据
np.random.seed(42)
npoints = 200
x = np.random.uniform(-2, 2, npoints)
y = np.random.uniform(-2, 2, npoints)
z = x * np.exp(-x**2 - y**2)

# 创建三角剖分
triang = Triangulation(x, y)

# 创建细化器
refiner = UniformTriRefiner(triang)
tri_refi, z_refi = refiner.refine_field(z, subdiv=3)

# 绘制细化后的等高线
plt.figure(figsize=(10, 8))
contours = plt.tricontourf(tri_refi, z_refi, levels=20, cmap='viridis')
plt.triplot(triang, 'k-', lw=0.5, alpha=0.5)
plt.colorbar(contours, label='Z Value')
plt.title('Contour Plot with Boundary Interpolation - how2matplotlib.com')
plt.xlabel('X')
plt.ylabel('Y')
plt.show()
Output:
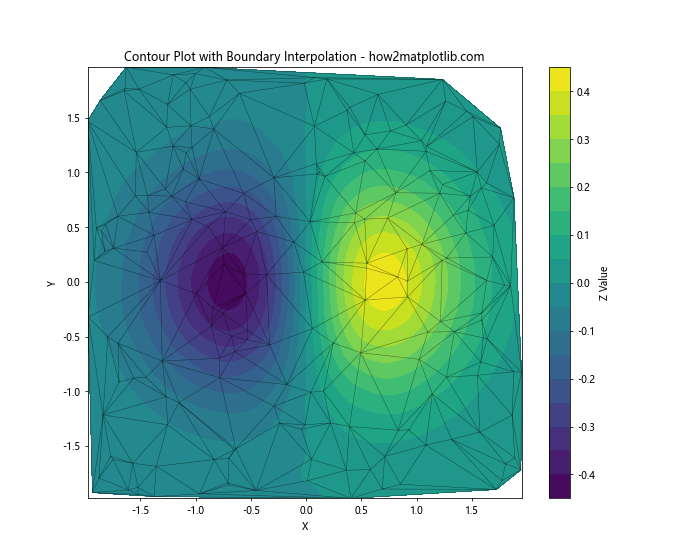
这个例子使用UniformTriRefiner对三角网格进行细化,从而得到更平滑的边界和等高线。
8. 3D可视化
虽然等高线图是2D的,但我们也可以创建3D表面图来更好地理解数据。
8.1 创建3D表面图
我们可以使用plot_trisurf函数来创建3D表面图:
import numpy as np
import matplotlib.pyplot as plt
from matplotlib.tri import Triangulation
from mpl_toolkits.mplot3d import Axes3D

# 生成数据
np.random.seed(42)
npoints = 200
x = np.random.uniform(-2, 2, npoints)
y = np.random.uniform(-2, 2, npoints)
z = x * np.exp(-x**2 - y**2)

# 创建三角剖分
triang = Triangulation(x, y)

# 创建3D表面图
fig = plt.figure(figsize=(10, 8))
ax = fig.add_subplot(111, projection='3d')
surf = ax.plot_trisurf(triang, z, cmap='viridis')
fig.colorbar(surf, label='Z Value')
ax.set_title('3D Surface Plot - how2matplotlib.com')
ax.set_xlabel('X')
ax.set_ylabel('Y')
ax.set_zlabel('Z')
plt.show()
Output:
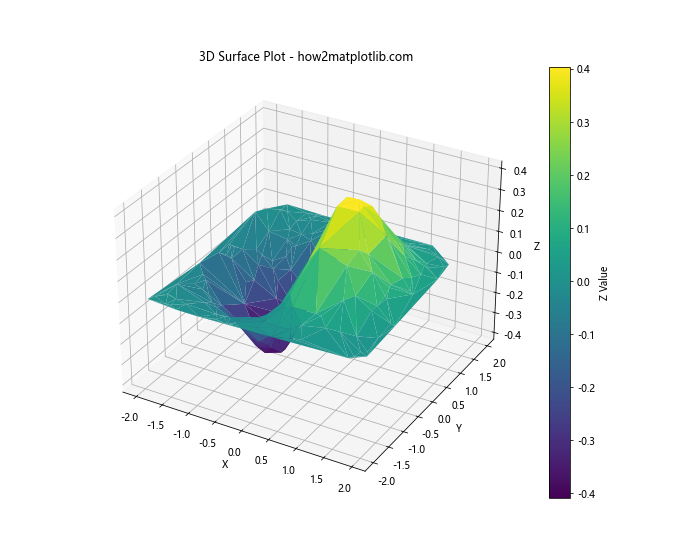
这个例子创建了一个3D表面图,可以直观地展示数据的三维结构。
8.2 添加等高线到3D图
我们还可以在3D表面上添加等高线:
import numpy as np
import matplotlib.pyplot as plt
from matplotlib.tri import Triangulation
from mpl_toolkits.mplot3d import Axes3D

# 生成数据
np.random.seed(42)
npoints = 200
x = np.random.uniform(-2, 2, npoints)
y = np.random.uniform(-2, 2, npoints)
z = x * np.exp(-x**2 - y**2)

# 创建三角剖分
triang = Triangulation(x, y)

# 创建3D表面图和等高线
fig = plt.figure(figsize=(12, 10))
ax = fig.add_subplot(111, projection='3d')
surf = ax.plot_trisurf(triang, z, cmap='viridis', alpha=0.7)
contours = ax.tricontour(triang, z, levels=15, colors='k', linewidths=0.5)
fig.colorbar(surf, label='Z Value')
ax.set_title('3D Surface Plot with Contours - how2matplotlib.com')
ax.set_xlabel('X')
ax.set_ylabel('Y')
ax.set_zlabel('Z')
plt.show()
Output:
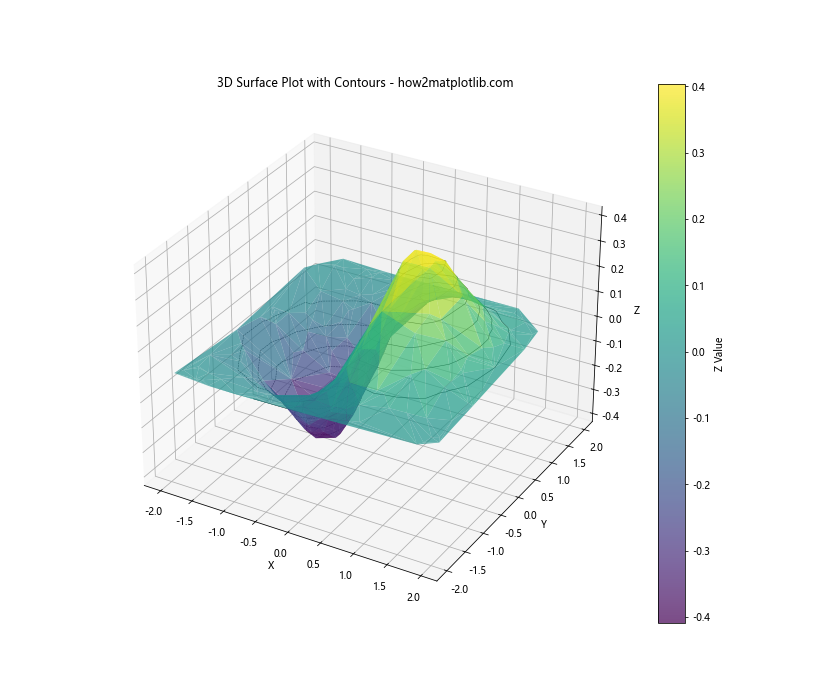
这个例子在3D表面上添加了等高线,提供了更丰富的数据可视化效果。
9. 高级技巧
最后,让我们探讨一些高级技巧,以进一步提升等高线图的质量和信息量。
9.1 使用对数刻度
对于数据范围跨越多个数量级的情况,使用对数刻度可能会更有帮助:
import numpy as np
import matplotlib.pyplot as plt
from matplotlib.tri import Triangulation

# 生成数据
np.random.seed(42)
npoints = 200
x = np.random.uniform(0.1, 10, npoints)
y = np.random.uniform(0.1, 10, npoints)
z = np.log(x) * np.log(y)

# 创建三角剖分
triang = Triangulation(x, y)

# 绘制对数刻度的等高线图
plt.figure(figsize=(10, 8))
contours = plt.tricontourf(triang, z, levels=15, cmap='viridis')
plt.colorbar(contours, label='Z Value')
plt.xscale('log')
plt.yscale('log')
plt.title('Contour Plot with Logarithmic Scale - how2matplotlib.com')
plt.xlabel('X (log scale)')
plt.ylabel('Y (log scale)')
plt.show()
Output:
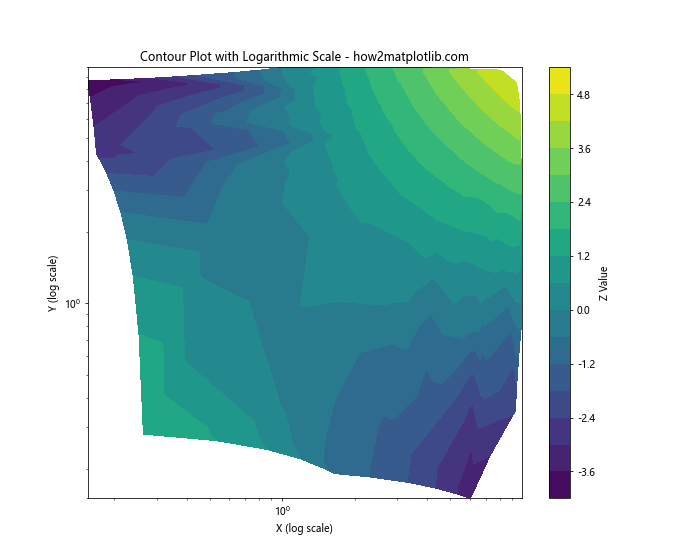
这个例子使用对数刻度来展示宽范围的数据,使得小值和大值的变化都能清晰地显示出来。
9.2 添加注释
我们可以在等高线图上添加注释,以突出显示特定的特征或区域:
import numpy as np
import matplotlib.pyplot as plt
from matplotlib.tri import Triangulation

# 生成数据
np.random.seed(42)
npoints = 200
x = np.random.uniform(-2, 2, npoints)
y = np.random.uniform(-2, 2, npoints)
z = x * np.exp(-x**2 - y**2)

# 创建三角剖分
triang = Triangulation(x, y)

# 绘制等高线图并添加注释
plt.figure(figsize=(10, 8))
contours = plt.tricontourf(triang, z, levels=15, cmap='viridis')
plt.colorbar(contours, label='Z Value')
plt.triplot(triang, 'k-', lw=0.5, alpha=0.3)

# 添加注释
plt.annotate('Maximum', xy=(0.7, 0), xytext=(1.5, 1),
             arrowprops=dict(facecolor='black', shrink=0.05))
plt.annotate('Minimum', xy=(-0.7, 0), xytext=(-1.5, -1),
             arrowprops=dict(facecolor='black', shrink=0.05))

plt.title('Contour Plot with Annotations - how2matplotlib.com')
plt.xlabel('X')
plt.ylabel('Y')
plt.show()
Output:
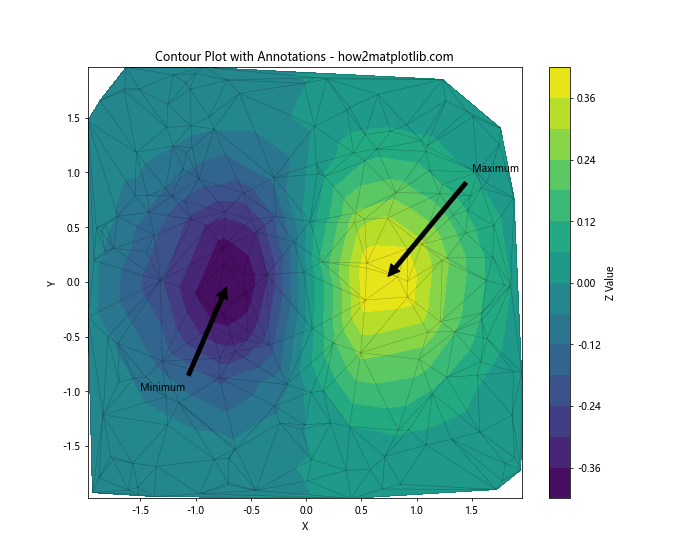
这个例子在等高线图上添加了两个注释,指出了数据的最大值和最小值区域。
10. 总结
在本文中,我们详细探讨了如何使用Matplotlib在Python中绘制非结构化三角网格上的等高线图。我们从基本概念开始,逐步深入到高级技巧,涵盖了以下主要内容:
- 非结构化三角网格的基本概念和创建方法
- 数据准备和基本等高线图的绘制
- 填充等高线和组合等高线图
- 自定义等高线的级别和颜色
- 添加网格和数据点以增强可视化效果
- 处理不规则边界的技巧
- 3D可视化方法
- 高级技巧如使用对数刻度和添加注释
通过掌握这些技术,读者应该能够创建出既美观又信息丰富的非结构化三角网格等高线图。这种可视化方法在许多科学和工程领域都有广泛应用,如地理信息系统、流体动力学、热传导分析等。
希望本文能够帮助读者更好地理解和应用这一强大的数据可视化工具。随着实践和经验的积累,读者将能够创建出更加复杂和精美的等高线图,以满足各种数据分析和展示需求。
 极客教程
极客教程