Matplotlib中使用facecolor更改图例背景:全面指南
参考:Change Legend background using facecolor in MatplotLib
Matplotlib是Python中强大的数据可视化库,它提供了丰富的功能来创建各种类型的图表和绘图。在数据可视化中,图例(Legend)是一个重要的组成部分,它帮助读者理解图表中不同元素的含义。本文将深入探讨如何在Matplotlib中使用facecolor属性来更改图例的背景颜色,以增强图表的可读性和美观性。
1. 图例背景的重要性
图例背景色的选择对于整体图表的视觉效果和可读性至关重要。适当的背景色可以:
- 提高图例与图表其他部分的对比度
- 突出显示重要信息
- 与整体图表设计保持一致
- 增强图表的美观性
让我们从一个简单的例子开始,看看如何在Matplotlib中创建一个基本的图例:
import matplotlib.pyplot as plt

plt.figure(figsize=(8, 6))
plt.plot([1, 2, 3, 4], [1, 4, 2, 3], label='Line 1')
plt.plot([1, 2, 3, 4], [2, 3, 4, 1], label='Line 2')
plt.title('Basic Plot with Legend - how2matplotlib.com')
plt.legend()
plt.show()
Output:
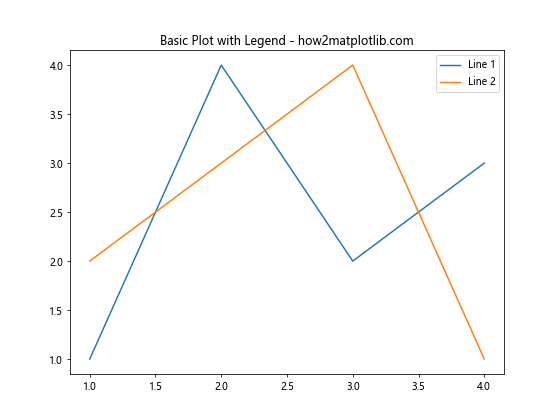
在这个例子中,我们创建了一个包含两条线的简单图表,并添加了一个默认的图例。默认情况下,图例的背景是透明的。
2. 使用facecolor更改图例背景
要更改图例的背景颜色,我们可以使用legend()函数的facecolor参数。这个参数接受各种颜色格式,包括颜色名称、RGB值和十六进制代码。
让我们看一个使用facecolor的例子:
import matplotlib.pyplot as plt

plt.figure(figsize=(8, 6))
plt.plot([1, 2, 3, 4], [1, 4, 2, 3], label='Line 1')
plt.plot([1, 2, 3, 4], [2, 3, 4, 1], label='Line 2')
plt.title('Plot with Colored Legend Background - how2matplotlib.com')
plt.legend(facecolor='lightblue')
plt.show()
Output:
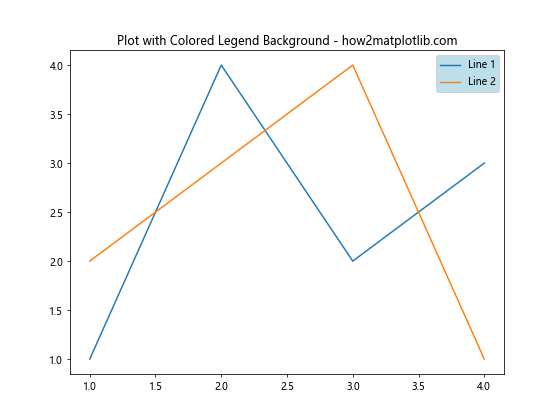
在这个例子中,我们将图例的背景色设置为浅蓝色。这样可以使图例更加突出,并与图表的其他部分形成对比。
3. 使用不同的颜色格式
Matplotlib支持多种颜色格式,让我们探索一些常用的格式:
3.1 使用颜色名称
import matplotlib.pyplot as plt

plt.figure(figsize=(8, 6))
plt.plot([1, 2, 3, 4], [1, 4, 2, 3], label='Data 1')
plt.plot([1, 2, 3, 4], [2, 3, 4, 1], label='Data 2')
plt.title('Legend with Named Color - how2matplotlib.com')
plt.legend(facecolor='lightyellow')
plt.show()
Output:
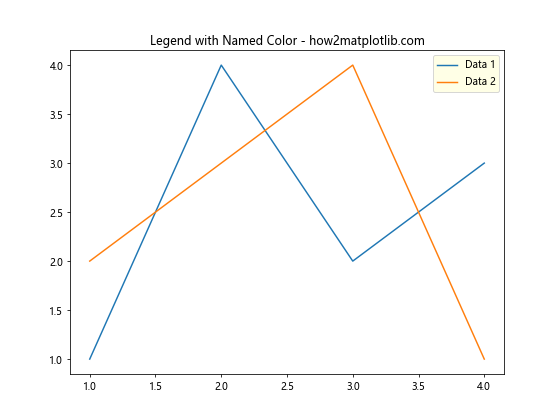
在这个例子中,我们使用了颜色名称’lightyellow’来设置图例背景。Matplotlib支持大量的颜色名称,可以根据需要选择合适的颜色。
3.2 使用RGB值
import matplotlib.pyplot as plt

plt.figure(figsize=(8, 6))
plt.plot([1, 2, 3, 4], [1, 4, 2, 3], label='Series A')
plt.plot([1, 2, 3, 4], [2, 3, 4, 1], label='Series B')
plt.title('Legend with RGB Color - how2matplotlib.com')
plt.legend(facecolor=(0.9, 0.9, 0.8))  # Light beige
plt.show()
Output:
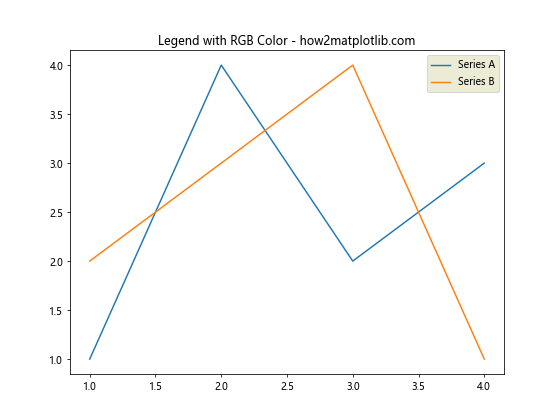
这个例子展示了如何使用RGB值来设置图例背景色。RGB值是一个包含三个0到1之间的浮点数的元组,分别代表红、绿、蓝的强度。
3.3 使用十六进制代码
import matplotlib.pyplot as plt

plt.figure(figsize=(8, 6))
plt.plot([1, 2, 3, 4], [1, 4, 2, 3], label='Group 1')
plt.plot([1, 2, 3, 4], [2, 3, 4, 1], label='Group 2')
plt.title('Legend with Hex Color - how2matplotlib.com')
plt.legend(facecolor='#E6E6FA')  # Lavender
plt.show()
Output:
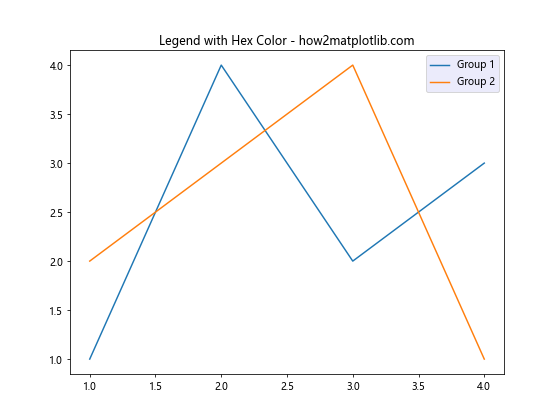
这个例子使用十六进制颜色代码来设置图例背景。十六进制代码是一种常见的颜色表示方法,特别是在Web开发中。
4. 调整图例的透明度
除了更改背景颜色,我们还可以调整图例的透明度。这可以通过alpha参数来实现:
import matplotlib.pyplot as plt

plt.figure(figsize=(8, 6))
plt.plot([1, 2, 3, 4], [1, 4, 2, 3], label='Data Set 1')
plt.plot([1, 2, 3, 4], [2, 3, 4, 1], label='Data Set 2')
plt.title('Legend with Transparency - how2matplotlib.com')
plt.legend(facecolor='green', alpha=0.3)
plt.show()
在这个例子中,我们将图例背景设置为绿色,并将透明度设置为0.3。这样可以让图例部分透明,使得背景的图表内容仍然可见。
5. 结合边框样式
图例的背景颜色可以与边框样式结合使用,以创建更加独特的外观:
import matplotlib.pyplot as plt

plt.figure(figsize=(8, 6))
plt.plot([1, 2, 3, 4], [1, 4, 2, 3], label='Trend A')
plt.plot([1, 2, 3, 4], [2, 3, 4, 1], label='Trend B')
plt.title('Legend with Custom Border - how2matplotlib.com')
plt.legend(facecolor='lightpink', edgecolor='red', borderpad=1)
plt.show()
Output:
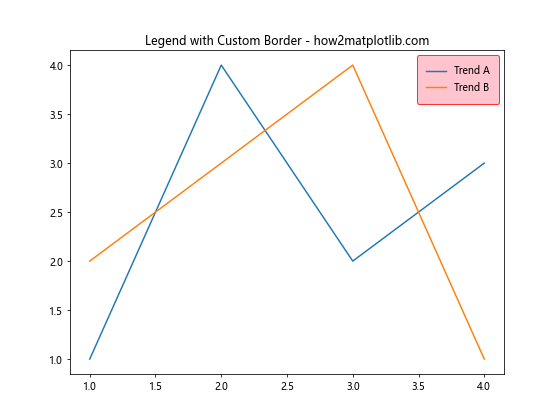
在这个例子中,我们不仅设置了背景颜色,还自定义了边框颜色和内边距。这样可以创建一个更加突出的图例样式。
6. 在子图中使用facecolor
当处理多个子图时,我们可以为每个子图的图例单独设置背景颜色:
import matplotlib.pyplot as plt

fig, (ax1, ax2) = plt.subplots(1, 2, figsize=(12, 5))

ax1.plot([1, 2, 3, 4], [1, 4, 2, 3], label='Data A')
ax1.set_title('Subplot 1 - how2matplotlib.com')
ax1.legend(facecolor='lightgreen')

ax2.plot([1, 2, 3, 4], [2, 3, 4, 1], label='Data B')
ax2.set_title('Subplot 2 - how2matplotlib.com')
ax2.legend(facecolor='lightsalmon')

plt.tight_layout()
plt.show()
Output:
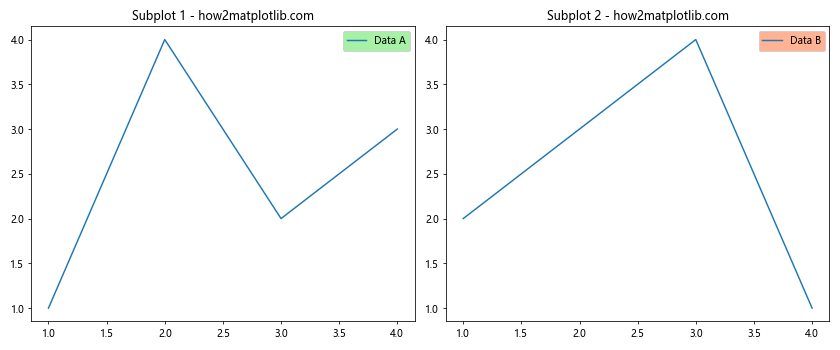
这个例子展示了如何在包含两个子图的图表中,为每个子图的图例设置不同的背景颜色。
7. 使用颜色映射(Colormap)
Matplotlib提供了丰富的颜色映射,我们可以利用这些映射来为图例背景选择颜色:
import matplotlib.pyplot as plt
import matplotlib.cm as cm

plt.figure(figsize=(8, 6))
for i in range(5):
    plt.plot([1, 2, 3, 4], [i, i+1, i+2, i+3], label=f'Line {i+1}')

cmap = cm.get_cmap('viridis')
plt.title('Legend with Colormap - how2matplotlib.com')
plt.legend(facecolor=cmap(0.7))
plt.show()
Output:
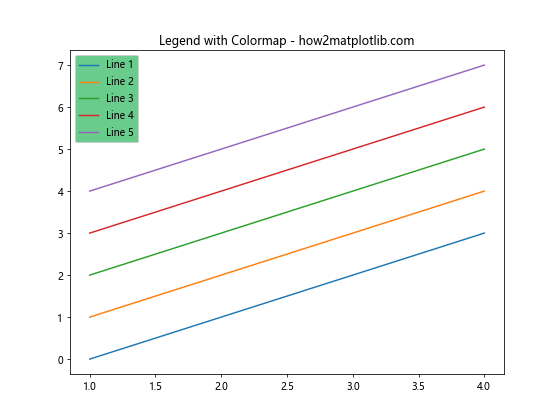
在这个例子中,我们使用了’viridis’颜色映射,并选择了映射中0.7位置的颜色作为图例背景。这种方法可以帮助我们选择与整体配色方案协调的背景色。
8. 根据数据动态设置背景颜色
有时,我们可能希望根据数据的特性动态设置图例的背景颜色。以下是一个简单的例子:
import matplotlib.pyplot as plt
import numpy as np

data = np.random.randn(100)
mean = np.mean(data)

plt.figure(figsize=(8, 6))
plt.hist(data, bins=20, label='Data Distribution')
plt.axvline(mean, color='red', linestyle='dashed', linewidth=2, label='Mean')

if mean > 0:
    legend_color = 'lightgreen'
else:
    legend_color = 'lightcoral'

plt.title('Dynamic Legend Background - how2matplotlib.com')
plt.legend(facecolor=legend_color)
plt.show()
Output:
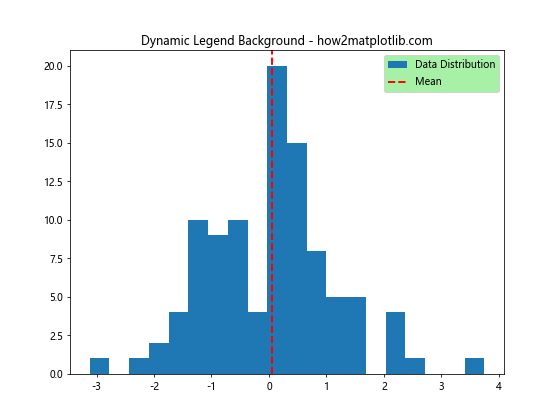
在这个例子中,我们根据数据的平均值来决定图例的背景颜色。如果平均值为正,使用浅绿色;如果为负,使用浅珊瑚色。
9. 使用渐变背景
虽然Matplotlib没有直接提供为图例设置渐变背景的功能,但我们可以通过一些技巧来实现类似的效果:
import matplotlib.pyplot as plt
import matplotlib.patches as patches
import matplotlib.colors as mcolors

fig, ax = plt.subplots(figsize=(8, 6))
ax.plot([1, 2, 3, 4], [1, 4, 2, 3], label='Data')

# 创建渐变色
gradient = mcolors.LinearSegmentedColormap.from_list("", ["lightblue", "white"])

# 创建一个矩形patch作为图例背景
legend = ax.legend(frameon=False)
frame = legend.get_frame()
patch = patches.Rectangle((0, 0), 1, 1, transform=frame.transAxes, fill=True,
                          facecolor=gradient(0.5), alpha=0.5)
frame.set_facecolor('none')
frame._drawBackground = lambda: None
legend._loc = 0
legend.set_zorder(1)
frame.set_zorder(0)
frame.add_artist(patch)

plt.title('Legend with Gradient Background - how2matplotlib.com')
plt.show()
这个例子创建了一个从浅蓝色到白色的渐变背景。虽然这种方法比较复杂,但它展示了Matplotlib的灵活性,允许我们创建更加复杂和独特的图例样式。
10. 结合其他图例属性
facecolor可以与其他图例属性结合使用,以创建更加个性化的图例样式:
import matplotlib.pyplot as plt

plt.figure(figsize=(8, 6))
plt.plot([1, 2, 3, 4], [1, 4, 2, 3], label='Series 1')
plt.plot([1, 2, 3, 4], [2, 3, 4, 1], label='Series 2')
plt.title('Advanced Legend Styling - how2matplotlib.com')
plt.legend(facecolor='lightyellow',
           edgecolor='orange',
           shadow=True,
           borderpad=1,
           labelspacing=1.2,
           handlelength=3)
plt.show()
Output:
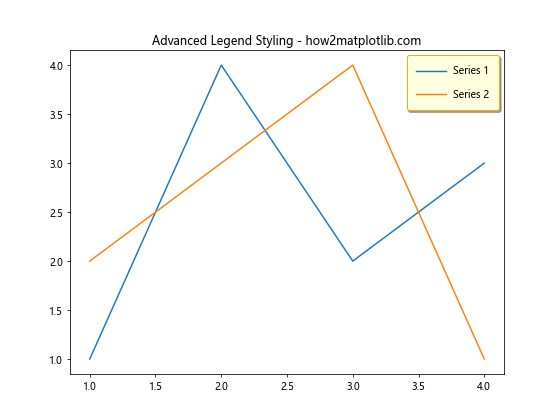
在这个例子中,我们不仅设置了背景颜色,还调整了边框颜色、添加了阴影效果、增加了内边距、调整了标签间距和图例标记的长度。这些属性的组合可以创建出非常独特和吸引人的图例样式。
11. 处理多列图例
当图例中包含多个项目时,我们可能需要将其分成多列。在这种情况下,facecolor仍然可以正常工作:
import matplotlib.pyplot as plt

plt.figure(figsize=(10, 6))
for i in range(6):
    plt.plot([1, 2, 3, 4], [i, i+1, i+2, i+3], label=f'Line {i+1}')

plt.title('Multi-column Legend - how2matplotlib.com')
plt.legend(facecolor='lightcyan', ncol=3, loc='upper center', bbox_to_anchor=(0.5, -0.05))
plt.tight_layout()
plt.show()
Output:
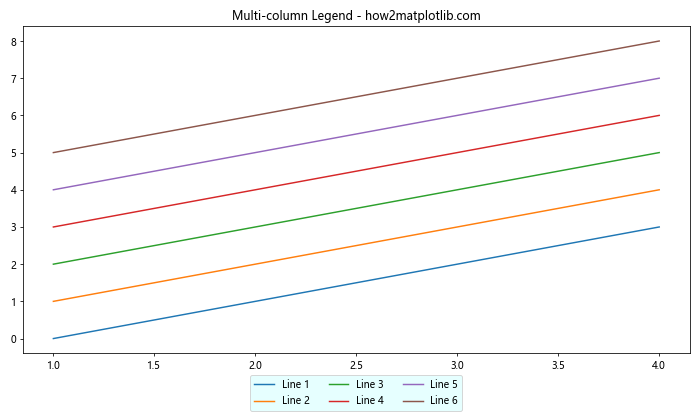
在这个例子中,我们创建了一个包含6个项目的图例,并将其分成3列。背景颜色被设置为浅青色,图例被放置在图表的底部中央。
12. 自定义图例项目样式
除了更改整个图例的背景颜色,我们还可以自定义每个图例项目的样式:
import matplotlib.pyplot as plt
from matplotlib.patches import Patch

fig, ax = plt.subplots(figsize=(8, 6))

# 创建自定义图例元素
legend_elements = [Patch(facecolor='red', edgecolor='r', label='Red'),
                   Patch(facecolor='green', edgecolor='g', label='Green'),
                   Patch(facecolor='blue', edgecolor='b', label='Blue')]

# 添加图例
ax.legend(handles=legend_elements, facecolor='lightgray')

plt.title('Custom Legend Items - how2matplotlib.com')
plt.axis('off')  # 隐藏坐标轴
plt.show()
Output:
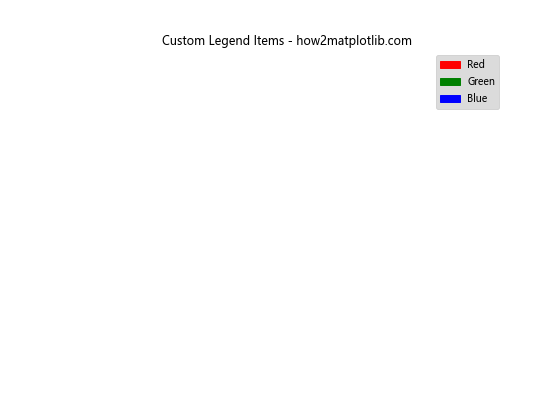
这个例子展示了如何创建自定义的图例项目,每个项目都有不同的颜色,同时整个图例的背景色设置为浅灰色。
13. 在3D图中使用facecolor
Matplotlib也支持3D图表,我们同样可以在3D图中为图例设置背景颜色:
import matplotlib.pyplot as plt
from mpl_toolkits.mplot3d import Axes3D
import numpy as np

fig = plt.figure(figsize=(8, 6))
ax = fig.add_subplot(111, projection='3d')

# 生成一些3D数据
x = np.random.rand(100)
y = np.random.rand(100)
z = np.random.rand(100)

ax.scatter(x, y, z, c='r', marker='o', label='Points')
ax.set_xlabel('X axis')
ax.set_ylabel('Y axis')
ax.set_zlabel('Z axis')

plt.title('3D Plot with Colored Legend - how2matplotlib.com')
ax.legend(facecolor='lightgreen')
plt.show()
Output:
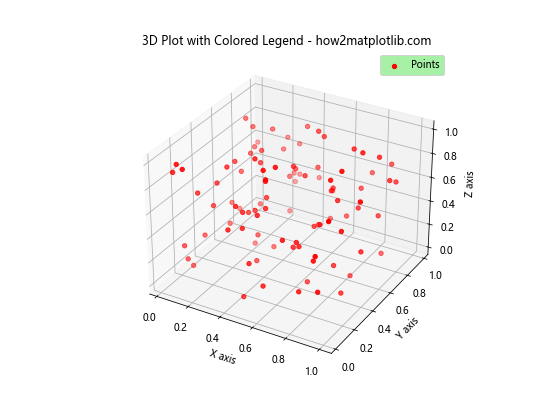
在这个例子中,我们创建了一个3D散点图,并为其图例设置了浅绿色背景。这展示了facecolor属性在不同类型的图表中的通用性。
14. 动画图表中的图例背景
在创建动画图表时,我们也可以动态更改图例的背景颜色:
import matplotlib.pyplot as plt
import matplotlib.animation as animation
import numpy as np

fig, ax = plt.subplots(figsize=(8, 6))
x = np.linspace(0, 2*np.pi, 100)
line, = ax.plot(x, np.sin(x), label='Sine Wave')

def animate(frame):
    line.set_ydata(np.sin(x + frame/10))
    legend = ax.legend(facecolor=plt.cm.viridis(frame/100))
    return line, legend

ani = animation.FuncAnimation(fig, animate, frames=100, interval=50, blit=True)
plt.title('Animated Legend Background - how2matplotlib.com')
plt.show()
Output:
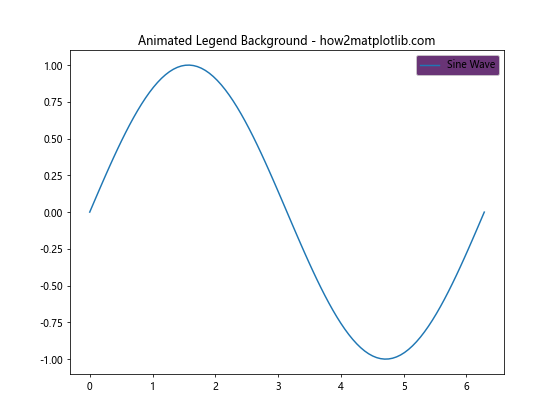
这个例子创建了一个简单的正弦波动画,同时图例的背景颜色也在不断变化。虽然这个动画不能在静态文档中显示,但它展示了如何在动态图表中操作图例背景。
15. 使用自定义样式
Matplotlib允许我们创建自定义样式,这可以包括图例背景的设置:
import matplotlib.pyplot as plt

# 定义自定义样式
plt.style.use({
    'legend.facecolor': 'lightblue',
    'legend.edgecolor': 'blue',
    'legend.framealpha': 0.8,
    'legend.borderpad': 1,
})

plt.figure(figsize=(8, 6))
plt.plot([1, 2, 3, 4], [1, 4, 2, 3], label='Custom Style Data')
plt.title('Plot with Custom Style - how2matplotlib.com')
plt.legend()
plt.show()
Output:
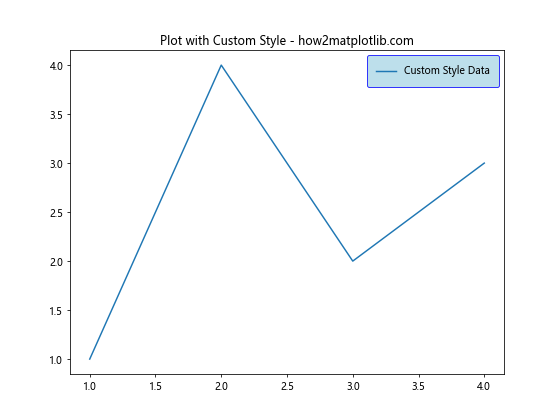
这个例子展示了如何创建一个自定义样式,其中包括图例背景的颜色、边框颜色、透明度和内边距的设置。使用自定义样式可以确保在整个项目中保持一致的图表外观。
16. 处理重叠问题
有时,图例可能会与图表的其他元素重叠。在这种情况下,适当的背景颜色可以提高可读性:
import matplotlib.pyplot as plt
import numpy as np

x = np.linspace(0, 10, 100)
y1 = np.sin(x)
y2 = np.cos(x)

plt.figure(figsize=(8, 6))
plt.plot(x, y1, label='Sine')
plt.plot(x, y2, label='Cosine')
plt.title('Overlapping Plot with Clear Legend - how2matplotlib.com')
plt.legend(facecolor='white', framealpha=1, loc='lower left')
plt.show()
Output:
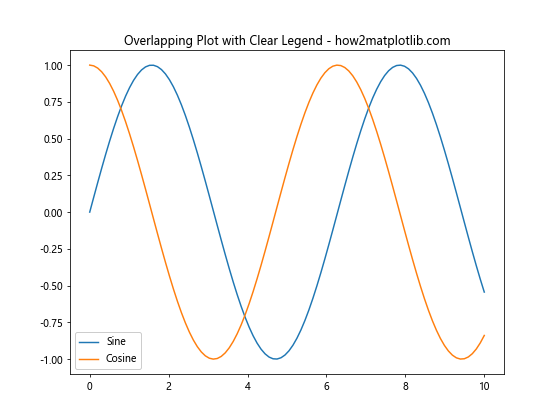
在这个例子中,我们将图例放在左下角,并给它一个不透明的白色背景。这确保了图例文本清晰可读,即使它与图表线条重叠。
17. 结合图例位置和背景色
图例的位置和背景色可以结合使用,以达到最佳的视觉效果:
import matplotlib.pyplot as plt
import numpy as np

x = np.linspace(0, 10, 100)
y1 = np.exp(-x/10) * np.sin(x)
y2 = np.exp(-x/10) * np.cos(x)

plt.figure(figsize=(8, 6))
plt.plot(x, y1, label='Damped Sine')
plt.plot(x, y2, label='Damped Cosine')
plt.title('Optimized Legend Placement - how2matplotlib.com')
plt.legend(facecolor='lightyellow', loc='upper right')
plt.show()
Output:
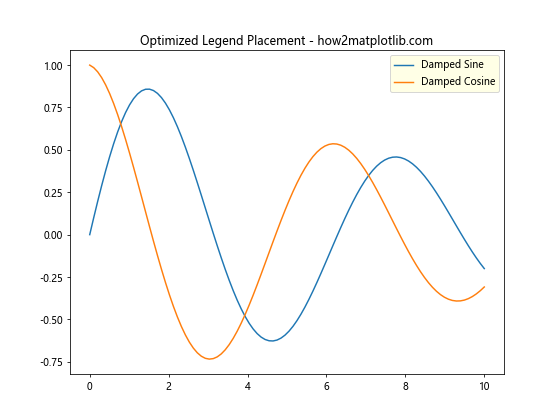
在这个例子中,我们将图例放在右上角,并给它一个浅黄色的背景。这种组合既不会遮挡重要的数据点,又能确保图例清晰可见。
18. 使用颜色循环
Matplotlib有一个内置的颜色循环,我们可以利用它来为图例背景选择颜色:
import matplotlib.pyplot as plt
import matplotlib.colors as mcolors

plt.figure(figsize=(8, 6))

colors = plt.rcParams['axes.prop_cycle'].by_key()['color']

for i, color in enumerate(colors[:4]):
    plt.plot([1, 2, 3, 4], [i, i+1, i+2, i+3], color=color, label=f'Line {i+1}')

legend = plt.legend(facecolor=mcolors.to_rgba(colors[4], alpha=0.3))
plt.title('Legend with Color from Cycle - how2matplotlib.com')
plt.show()
Output:
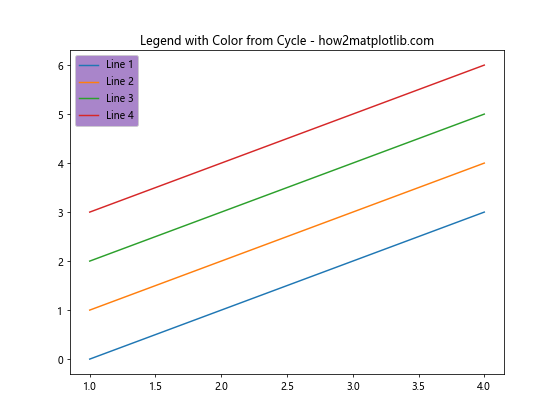
这个例子使用了Matplotlib的默认颜色循环中的颜色。我们用前四种颜色绘制线条,然后用第五种颜色(带有一些透明度)作为图例的背景色。
19. 响应式图例背景
在某些情况下,我们可能希望图例的背景颜色能够根据图表的整体亮度自动调整:
import matplotlib.pyplot as plt
import numpy as np

def adjust_legend_color(ax):
    # 获取图表的平均亮度
    img = ax.get_figure().canvas.buffer_rgba()
    avg_color = np.mean(img[:,:,:3])

    # 根据亮度选择图例背景色
    if avg_color > 128:
        return 'black', 'white'
    else:
        return 'white', 'black'

x = np.linspace(0, 10, 100)
y = np.sin(x)

plt.figure(figsize=(8, 6))
plt.plot(x, y, 'w', label='Sine Wave')
plt.title('Responsive Legend Background - how2matplotlib.com', color='white')
plt.gca().set_facecolor('black')

bg_color, text_color = adjust_legend_color(plt.gca())
plt.legend(facecolor=bg_color, labelcolor=text_color)

plt.show()
这个例子演示了如何创建一个响应式的图例背景。它会根据图表的整体亮度来决定使用深色还是浅色背景,以确保图例始终清晰可见。
20. 结合图例样式和数据特征
最后,我们可以根据数据的特征来调整图例的样式,包括背景颜色:
import matplotlib.pyplot as plt
import numpy as np

def get_trend_color(data):
    trend = np.polyfit(range(len(data)), data, 1)[0]
    return 'lightgreen' if trend > 0 else 'lightcoral'

np.random.seed(42)
data1 = np.cumsum(np.random.randn(100))
data2 = np.cumsum(np.random.randn(100))

plt.figure(figsize=(10, 6))
plt.plot(data1, label='Series 1')
plt.plot(data2, label='Series 2')

color1 = get_trend_color(data1)
color2 = get_trend_color(data2)

legend = plt.legend()
legend.get_texts()[0].set_color(color1)
legend.get_texts()[1].set_color(color2)
legend.get_frame().set_facecolor('lightgray')

plt.title('Data-Driven Legend Styling - how2matplotlib.com')
plt.show()
Output:
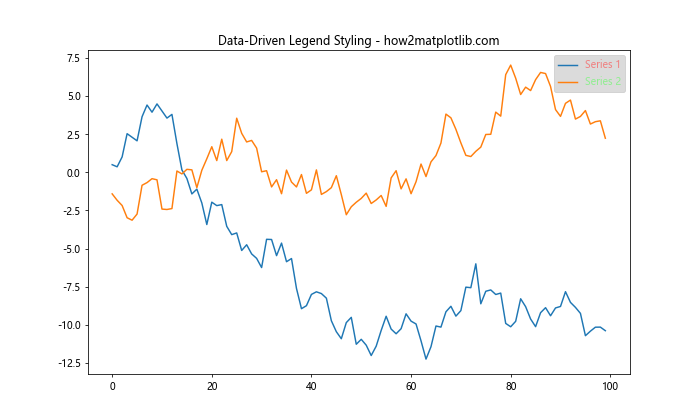
在这个例子中,我们根据每个数据系列的趋势来决定其在图例中的文本颜色。同时,我们为整个图例设置了一个浅灰色的背景。这种方法可以直观地传达数据的额外信息,同时保持图例的整体一致性。
结论
通过本文的详细探讨,我们可以看到Matplotlib中使用facecolor来更改图例背景是一个强大而灵活的工具。从简单的颜色设置到复杂的动态样式,facecolor属性为我们提供了丰富的选择来增强图表的可读性和美观性。
在实际应用中,选择合适的图例背景颜色应考虑以下因素:
1. 与整体图表设计的协调性
2. 数据的特性和重要性
3. 图表的目标受众
4. 展示环境(如印刷品、屏幕展示等)
通过合理使用facecolor和其他图例属性,我们可以创建既信息丰富又视觉吸引的数据可视化作品。记住,好的数据可视化不仅仅是展示数据,更是讲述数据背后的故事。精心设计的图例可以成为这个故事中的重要角色,帮助读者更好地理解和解释数据。
 极客教程
极客教程