bbox_to_anchor
在matplotlib中,bbox_to_anchor是一个非常有用的函数,用于在图中设置标注或图例的位置。该函数可以根据指定的锚点来调整标注或图例的位置,使其位于指定的坐标位置。
使用bbox_to_anchor设置标注位置
import matplotlib.pyplot as plt

fig, ax = plt.subplots()
ax.plot([1, 2, 3, 4], [1, 4, 2, 3])

bbox_props = dict(boxstyle="round,pad=0.3", fc="cyan", ec="b", lw=2)
ax.annotate('how2matplotlib.com', xy=(2, 3), xytext=(3, 3),
            arrowprops=dict(facecolor='black', shrink=0.05),
            bbox=bbox_props, bbox_to_anchor=(0.5, 0.5))

plt.show()
在上面的示例中,我们使用annotate函数在点(2, 3)处添加了一个带有文本’how2matplotlib.com’的标注。通过设置参数bbox_to_anchor=(0.5, 0.5),我们将文本框的锚点设置为中心点,使得文本框在指定的坐标位置(3, 3)位置处。
使用bbox_to_anchor设置图例位置
import matplotlib.pyplot as plt

fig, ax = plt.subplots()
line1, = ax.plot([1, 2, 3, 4], label='Line 1', linestyle='--')
line2, = ax.plot([4, 3, 2, 1], label='Line 2', linestyle='-.')
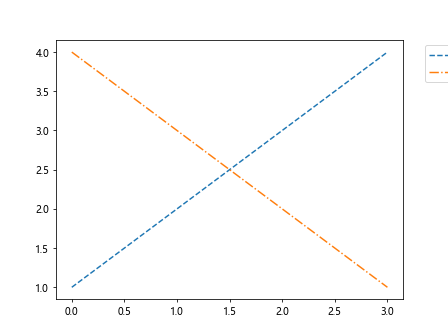
ax.legend(bbox_to_anchor=(1.05, 1), loc='upper left')

plt.show()
Output:

在上面的示例中,我们使用legend函数在图中添加了一个图例,通过设置参数bbox_to_anchor=(1.05, 1),将图例的锚点设置为右上角,使得图例位于图的右上方。
设置锚点为角落位置
import matplotlib.pyplot as plt

fig, ax = plt.subplots()
ax.plot([1, 2, 3, 4])
ax.text(0.5, 0.5, 'how2matplotlib.com', fontsize=12, va='bottom', ha='right', bbox=dict(facecolor='red', alpha=0.5), bbox_to_anchor=(0, 0))
plt.show()
在上面的示例中,我们使用text函数添加了一个文本框,通过设置参数bbox_to_anchor=(0, 0),将文本框的锚点设置为左下角,使得文本框位于图的左下方。
设置锚点为外部位置
import matplotlib.pyplot as plt

fig, ax = plt.subplots()
ax.text(0.5, 0.5, 'how2matplotlib.com', fontsize=12, va='bottom', ha='right', bbox=dict(facecolor='blue', alpha=0.5), bbox_to_anchor=(1, 1))
plt.show()
在上面的示例中,我们使用text函数添加了一个文本框,通过设置参数bbox_to_anchor=(1, 1),将文本框的锚点设置为右上角的外部位置,使得文本框位于图的右上角外部。
设置锚点为中心位置
import matplotlib.pyplot as plt

fig, ax = plt.subplots()
ax.text(0.5, 0.5, 'how2matplotlib.com', fontsize=12, va='center', ha='center', bbox=dict(facecolor='green', alpha=0.5), bbox_to_anchor=(0.5, 0.5))
plt.show()
在上面的示例中,我们使用text函数添加了一个文本框,通过设置参数bbox_to_anchor=(0.5, 0.5),将文本框的锚点设置为中心位置,使得文本框位于图的中心位置。
设置锚点为底部中心位置
import matplotlib.pyplot as plt

fig, ax = plt.subplots()
ax.text(0.5, 0.5, 'how2matplotlib.com', fontsize=12, va='top', ha='center', bbox=dict(facecolor='yellow', alpha=0.5), bbox_to_anchor=(0.5, 0))
plt.show()
在上面的示例中,我们使用text函数添加了一个文本框,通过设置参数bbox_to_anchor=(0.5, 0),将文本框的锚点设置为底部中心位置,使得文本框位于图的底部中心位置。
设置图例位置为底部中心位置
import matplotlib.pyplot as plt

fig, ax = plt.subplots()
line1, = ax.plot([1, 2, 3, 4], label='Line 1', linestyle='--')
line2, = ax.plot([4, 3, 2, 1], label='Line 2', linestyle='-.')
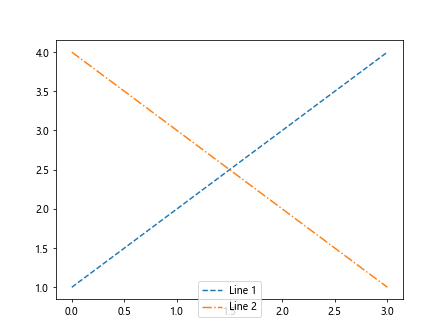
ax.legend(loc='center', bbox_to_anchor=(0.5, 0))
plt.show()
Output:

在上面的示例中,我们使用legend函数添加了一个图例,通过设置参数bbox_to_anchor=(0.5, 0),将图例的锚点设置为底部中心位置,使得图例位于图的底部中心位置。
综上所述,bbox_to_anchor函数可以帮助我们在matplotlib中更灵活地调整标注或图例的位置,使得图表更具美感和可读性。通过设置不同的锚点位置,我们可以随心所欲地控制标注或图例的位置,使其更好地融入图表中。
 极客教程
极客教程