Matplotlib ax.scatter 的详细介绍与应用
参考:ax.scatter
在数据可视化的领域,散点图是一种非常重要的图表类型,它可以帮助我们理解变量之间的关系。在 Python 的 Matplotlib 库中,ax.scatter 是生成散点图的一个常用方法。本文将详细介绍 ax.scatter 的使用方法,并通过多个示例展示如何利用这个功能创建各种散点图。
1. ax.scatter 基础
ax.scatter 方法主要用于在图表中绘制散点。它的基本语法如下:
scatter(x, y, s=None, c=None, marker=None, cmap=None, norm=None, vmin=None, vmax=None, alpha=None, linewidths=None, edgecolors=None)
x,y:分别代表点的横坐标和纵坐标。s:点的大小。c:点的颜色。marker:点的形状。cmap:颜色映射表。norm:在颜色映射中使用的归一化方法。vmin,vmax:颜色映射的最小值和最大值。alpha:点的透明度。linewidths:点的边缘线宽。edgecolors:点的边缘颜色。
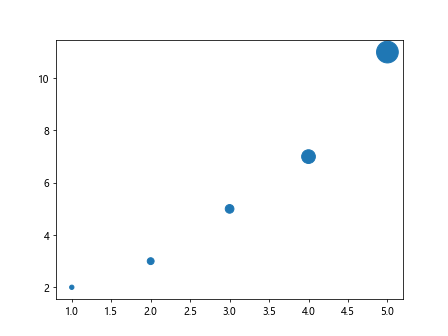
示例代码 1:基本散点图
import matplotlib.pyplot as plt

x = [1, 2, 3, 4, 5]
y = [2, 3, 5, 7, 11]
sizes = [20, 50, 80, 200, 500]

fig, ax = plt.subplots()
ax.scatter(x, y, s=sizes)
plt.show()
Output:
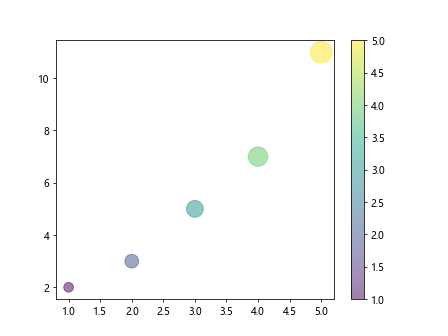
示例代码 2:自定义颜色和透明度
import matplotlib.pyplot as plt

x = [1, 2, 3, 4, 5]
y = [2, 3, 5, 7, 11]
colors = [1, 2, 3, 4, 5]
sizes = [100, 200, 300, 400, 500]

fig, ax = plt.subplots()
scatter = ax.scatter(x, y, s=sizes, c=colors, cmap='viridis', alpha=0.5)
plt.colorbar(scatter)
plt.show()
Output:
2. 颜色和颜色条
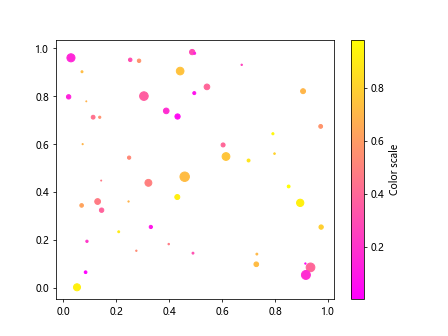
在散点图中,颜色不仅可以用来美化图表,还可以表示数据的一个维度。通过颜色映射(colormap),我们可以将数值映射到颜色上,从而在视觉上展示更多信息。
示例代码 3:使用颜色条表示数据大小
import matplotlib.pyplot as plt
import numpy as np

x = np.random.rand(50)
y = np.random.rand(50)
sizes = np.power(10, np.random.rand(50) * 2)
colors = np.random.rand(50)

fig, ax = plt.subplots()
scatter = ax.scatter(x, y, s=sizes, c=colors, cmap='spring')
plt.colorbar(scatter, label='Color scale')
plt.show()
Output:
3. 点的大小和形状
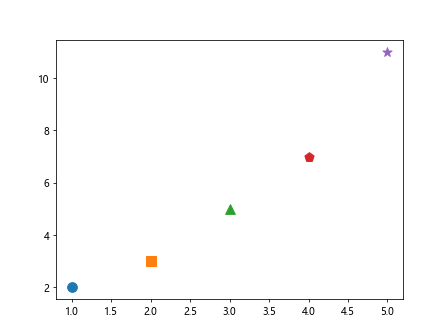
点的大小通常用来表示数据的另一个维度,而点的形状可以用来区分不同类别的数据点。
示例代码 4:改变点的形状
import matplotlib.pyplot as plt

x = [1, 2, 3, 4, 5]
y = [2, 3, 5, 7, 11]
markers = ['o', 's', '^', 'p', '*']

fig, ax = plt.subplots()
for xi, yi, mi in zip(x, y, markers):
    ax.scatter(xi, yi, marker=mi, s=100)
plt.show()
Output:
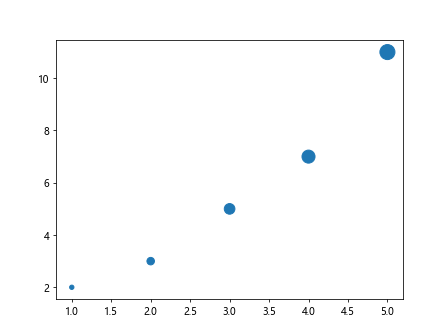
示例代码 5:不同大小的点
import matplotlib.pyplot as plt

x = [1, 2, 3, 4, 5]
y = [2, 3, 5, 7, 11]
sizes = [20, 60, 120, 180, 240]

fig, ax = plt.subplots()
ax.scatter(x, y, s=sizes)
plt.show()
Output:
4. 边缘颜色和线宽
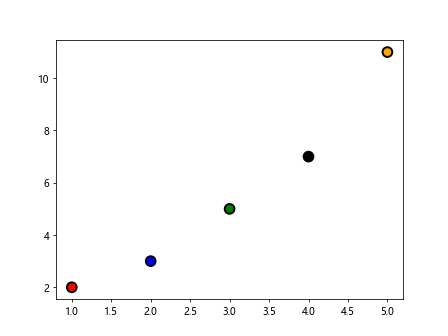
有时候,为了让散点图中的点更加突出,我们可以给点添加边缘颜色和调整线宽。
示例代码 6:设置点的边缘颜色和线宽
import matplotlib.pyplot as plt

x = [1, 2, 3, 4, 5]
y = [2, 3, 5, 7, 11]
colors = ['red', 'blue', 'green', 'black', 'orange']

fig, ax = plt.subplots()
ax.scatter(x, y, s=100, edgecolors='black', linewidths=2, c=colors)
plt.show()
Output:
5. 高级应用
ax.scatter 不仅限于简单的散点图,它还可以用于更复杂的数据可视化任务,如动态更新的散点图、交互式数据点等。
示例代码 7:动态更新散点图
import matplotlib.pyplot as plt
import numpy as np

fig, ax = plt.subplots()
x, y = np.random.rand(2, 100)
sc = ax.scatter(x, y)

def update(frame):
    sc.set_offsets(np.c_[np.random.rand(100), np.random.rand(100)])

ani = matplotlib.animation.FuncAnimation(fig, update, frames=10, interval=100)
plt.show()
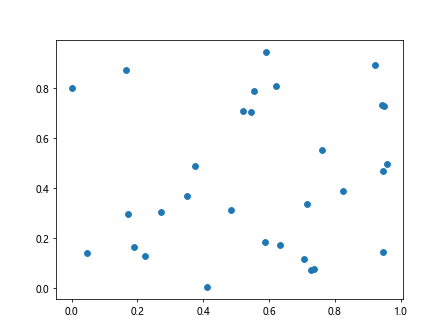
示例代码 8:交互式散点图
import matplotlib.pyplot as plt
import numpy as np

fig, ax = plt.subplots()
x, y = np.random.rand(2, 30)
sc = ax.scatter(x, y)

def on_pick(event):
    ind = event.ind
    print('Selected point:', x[ind], y[ind])

fig.canvas.mpl_connect('pick_event', on_pick)
plt.show()
Output:
结论
通过本文的介绍和示例,我们可以看到 ax.scatter 是一个功能强大且灵活的工具,可以帮助我们在 Python 中创建各种复杂和美观的散点图。无论是在科学研究、数据分析还是商业报告中,合理使用 ax.scatter 都能有效地帮助我们展示和分析数据。
 极客教程
极客教程