Matplotlib ax title 的使用与探索
参考:ax title
在数据可视化的过程中,图表的标题(Title)是传达图表主旨的重要元素之一。在Python的Matplotlib库中,ax.set_title() 方法是设置坐标轴标题的常用方式。本文将详细介绍如何在Matplotlib中使用 ax.set_title() 方法来设置和定制坐标轴标题,以及如何通过不同的参数调整标题样式,使其更符合用户的需求。
基本用法
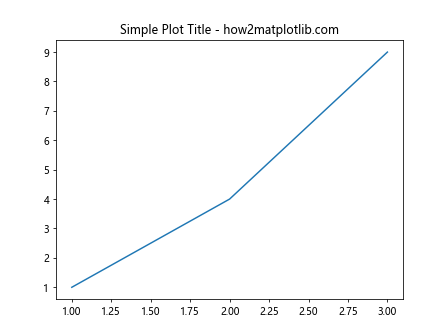
在Matplotlib中,ax.set_title() 方法用于设置坐标轴的标题。以下是一些基本的示例,展示如何在图表中添加标题。
示例代码 1:设置简单的坐标轴标题
import matplotlib.pyplot as plt

fig, ax = plt.subplots()
ax.plot([1, 2, 3], [1, 4, 9])
ax.set_title('Simple Plot Title - how2matplotlib.com')
plt.show()
Output:
示例代码 2:调整标题位置
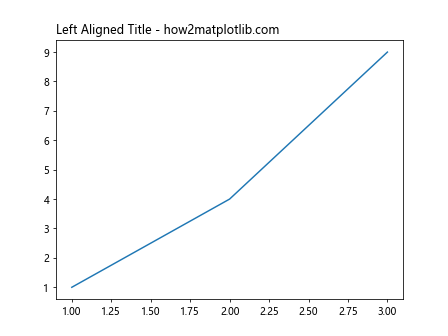
在Matplotlib中,可以通过 loc 参数来调整标题的位置。loc 参数的可选值包括:’left’, ‘center’, ‘right’。
import matplotlib.pyplot as plt

fig, ax = plt.subplots()
ax.plot([1, 2, 3], [1, 4, 9])
ax.set_title('Left Aligned Title - how2matplotlib.com', loc='left')
plt.show()
Output:
示例代码 3:设置标题字体大小
通过 fontsize 参数可以调整标题的字体大小。
import matplotlib.pyplot as
plt

fig, ax = plt.subplots()
ax.plot([1, 2, 3], [1, 4, 9])
ax.set_title('Title with Large Font Size - how2matplotlib.com', fontsize=20)
plt.show()
示例代码 4:设置标题字体颜色
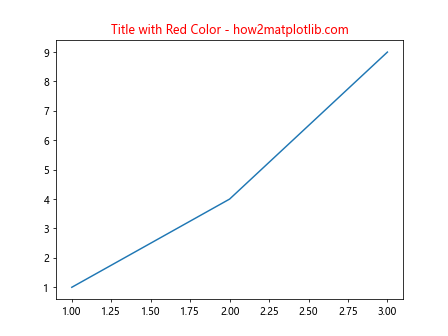
通过 color 参数可以设置标题的字体颜色。
import matplotlib.pyplot as plt

fig, ax = plt.subplots()
ax.plot([1, 2, 3], [1, 4, 9])
ax.set_title('Title with Red Color - how2matplotlib.com', color='red')
plt.show()
Output:
示例代码 5:设置标题字体样式
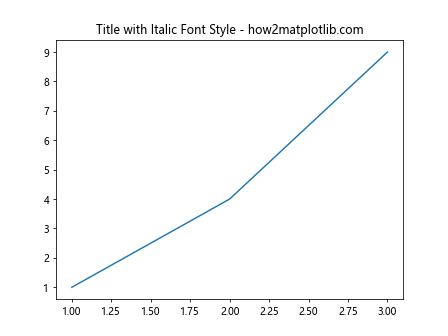
可以通过 fontstyle 参数来设置标题的字体样式。
import matplotlib.pyplot as plt

fig, ax = plt.subplots()
ax.plot([1, 2, 3], [1, 4, 9])
ax.set_title('Title with Italic Font Style - how2matplotlib.com', fontstyle='italic')
plt.show()
Output:
高级定制
除了基本的标题设置,Matplotlib还提供了更多的参数来帮助用户定制复杂和具有吸引力的标题样式。
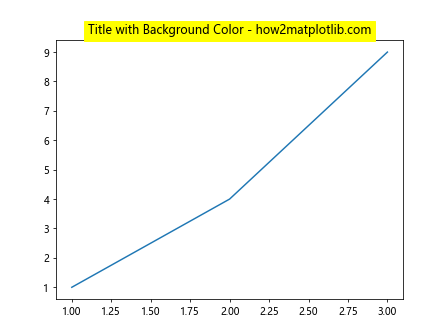
示例代码 6:设置标题的背景颜色
通过 backgroundcolor 参数可以设置标题的背景颜色。
import matplotlib.pyplot as plt

fig, ax = plt.subplots()
ax.plot([1, 2, 3], [1, 4, 9])
ax.set_title('Title with Background Color - how2matplotlib.com', backgroundcolor='yellow')
plt.show()
Output:
示例代码 7:设置标题的透明度
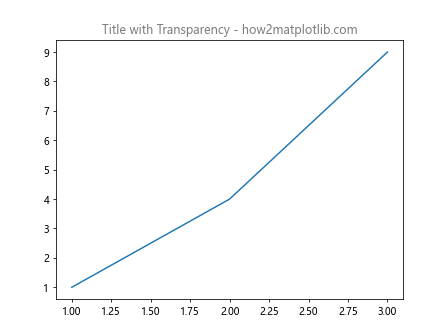
通过 alpha 参数可以设置标题文字的透明度。
import matplotlib.pyplot as plt

fig, ax = plt.subplots()
ax.plot([1, 2, 3], [1, 4, 9])
ax.set_title('Title with Transparency - how2matplotlib.com', alpha=0.5)
plt.show()
Output:
示例代码 8:设置标题边框
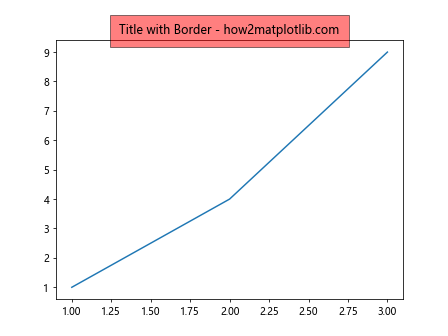
通过 bbox 参数可以给标题添加边框。bbox 参数需要一个字典来定义边框的样式。
import matplotlib.pyplot as plt

fig, ax = plt.subplots()
ax.plot([1, 2, 3], [1, 4, 9])
ax.set_title('Title with Border - how2matplotlib.com', bbox={'facecolor':'red', 'alpha':0.5, 'pad':10})
plt.show()
Output:
示例代码 9:使用多样式标题
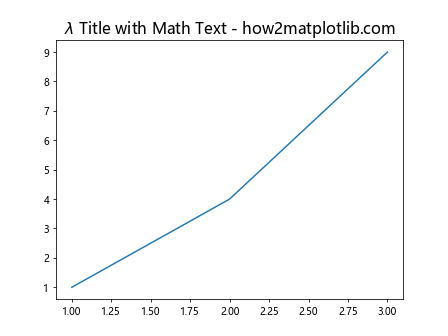
可以通过传递富文本标签来创建包含多种样式的标题。
import matplotlib.pyplot as plt

fig, ax = plt.subplots()
ax.plot([1, 2, 3], [1, 4, 9])
title_text = r'\lambda Title with Math Text - how2matplotlib.com'
ax.set_title(title_text, fontsize=16)
plt.show()
Output:
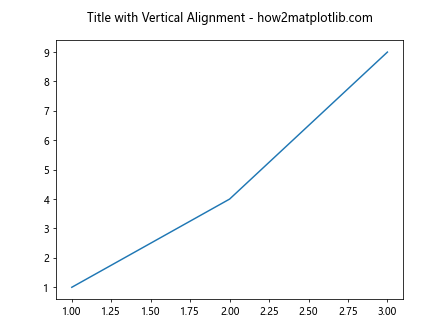
示例代码 10:设置标题的垂直位置
通过 y 参数可以调整标题在垂直方向上的位置。
import matplotlib.pyplot as plt

fig, ax = plt.subplots()
ax.plot([1, 2, 3], [1, 4, 9])
ax.set_title('Title with Vertical Alignment - how2matplotlib.com', y=1.05)
plt.show()
Output:
以上示例展示了如何在Matplotlib中设置和定制坐标轴标题。通过这些示例,我们可以看到 ax.set_title() 方法提供了丰富的参数来帮助用户创建符合自己需求的图表标题。在实际应用中,合理地使用这些参数可以使图表的信息传递更加清晰和有效。
 极客教程
极客教程