Axes Set Title 使用指南
在数据可视化的过程中,为图表添加标题是一个常见的需求,它可以帮助观众快速理解图表所表达的主题和内容。本文将详细介绍如何在使用Matplotlib库时,为图表的坐标轴设置标题。我们将通过一系列的示例代码,展示不同的设置方法和技巧,以帮助读者更有效地使用这一功能。
1. 基本用法
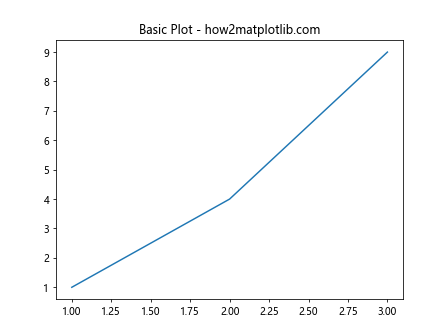
在Matplotlib中,set_title 方法是 Axes 对象的一个方法,用于设置坐标轴的标题。下面是一个基本的示例:
import matplotlib.pyplot as plt

fig, ax = plt.subplots()
ax.plot([1, 2, 3], [1, 4, 9])
ax.set_title('Basic Plot - how2matplotlib.com')
plt.show()
Output:
2. 自定义标题样式
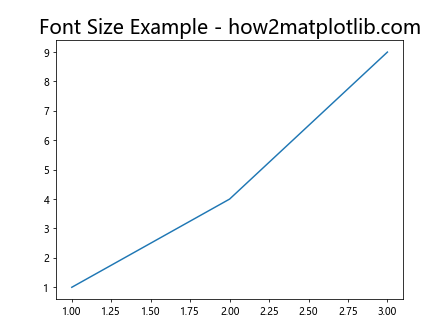
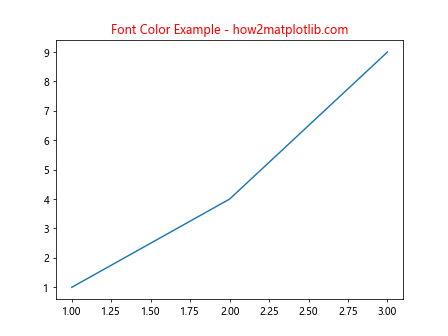
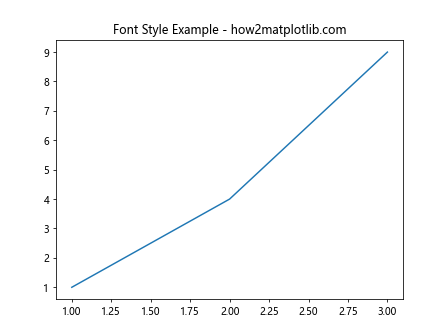
标题的样式可以通过传递参数来自定义,如字体大小、颜色和字体样式等。
2.1 设置字体大小
import matplotlib.pyplot as plt

fig, ax = plt.subplots()
ax.plot([1, 2, 3], [1, 4, 9])
ax.set_title('Font Size Example - how2matplotlib.com', fontsize=20)
plt.show()
Output:
2.2 设置字体颜色
import matplotlib.pyplot as plt

fig, ax = plt.subplots()
ax.plot([1, 2, 3], [1, 4, 9])
ax.set_title('Font Color Example - how2matplotlib.com', color='red')
plt.show()
Output:
2.3 设置字体样式
import matplotlib.pyplot as plt

fig, ax = plt.subplots()
ax.plot([1, 2, 3], [1, 4, 9])
ax.set_title('Font Style Example - how2matplotlib.com', style='italic')
plt.show()
Output:
3. 调整标题位置
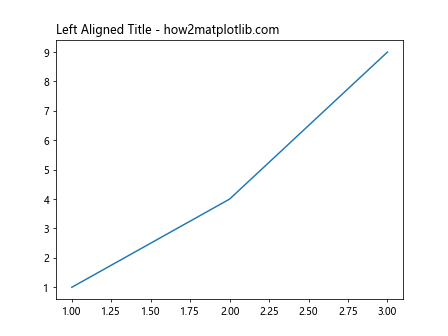
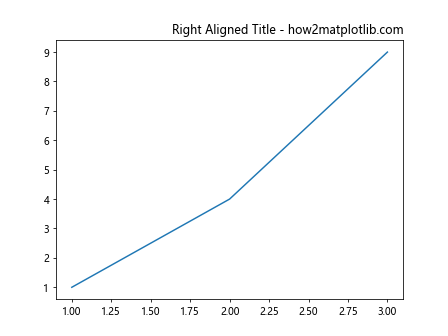
标题的位置可以通过 loc 参数进行调整,常用的值有 'left', 'right', 和 'center'。
3.1 将标题置于左侧
import matplotlib.pyplot as plt

fig, ax = plt.subplots()
ax.plot([1, 2, 3], [1, 4, 9])
ax.set_title('Left Aligned Title - how2matplotlib.com', loc='left')
plt.show()
Output:
3.2 将标题置于右侧
import matplotlib.pyplot as plt

fig, ax = plt.subplots()
ax.plot([1, 2, 3], [1, 4, 9])
ax.set_title('Right Aligned Title - how2matplotlib.com', loc='right')
plt.show()
Output:
4. 使用多行标题
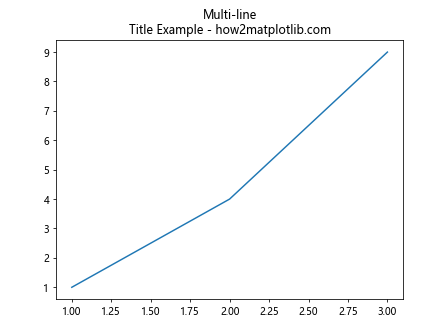
如果需要在标题中使用多行文本,可以在字符串中使用 \n 来换行。
import matplotlib.pyplot as plt

fig, ax = plt.subplots()
ax.plot([1, 2, 3], [1, 4, 9])
ax.set_title('Multi-line\nTitle Example - how2matplotlib.com')
plt.show()
Output:
5. 添加副标题
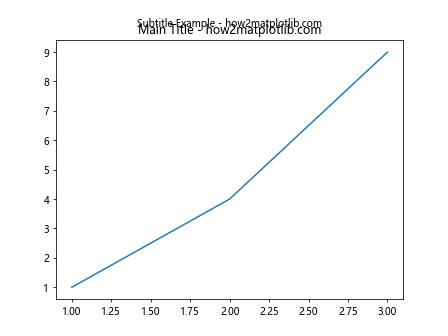
除了主标题外,有时我们可能需要添加副标题来提供更多信息。这可以通过添加额外的 text 方法来实现。
import matplotlib.pyplot as plt

fig, ax = plt.subplots()
ax.plot([1, 2, 3], [1, 4, 9])
ax.set_title('Main Title - how2matplotlib.com')
ax.text(0.5, 1.05, 'Subtitle Example - how2matplotlib.com', transform=ax.transAxes, ha='center')
plt.show()
Output:
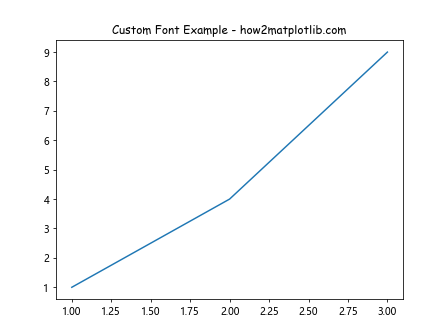
6. 使用不同的字体
为了使图表更具个性化,我们可以通过设置不同的字体来美化标题。
import matplotlib.pyplot as plt

fig, ax = plt.subplots()
ax.plot([1, 2, 3], [1, 4, 9])
ax.set_title('Custom Font Example - how2matplotlib.com', fontname='Comic Sans MS')
plt.show()
Output:
7. 调整标题与图表的距离
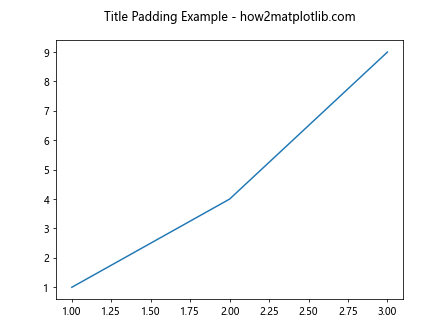
有时候默认的标题位置可能与图表太近或太远,我们可以通过调整 pad 参数来改变它们之间的距离。
import matplotlib.pyplot as plt

fig, ax = plt.subplots()
ax.plot([1, 2, 3], [1, 4, 9])
ax.set_title('Title Padding Example - how2matplotlib.com', pad=20)
plt.show()
Output:
8. 使用阴影效果
为标题添加阴影可以使其更加突出。
import matplotlib.pyplot as plt

fig, ax = plt.subplots()
ax.plot([1, 2, 3], [1, 4, 9])
title = ax.set_title('Shadow Effect Example - how2matplotlib.com')
title.set_path_effects([path_effects.withSimplePatchShadow()])
plt.show()
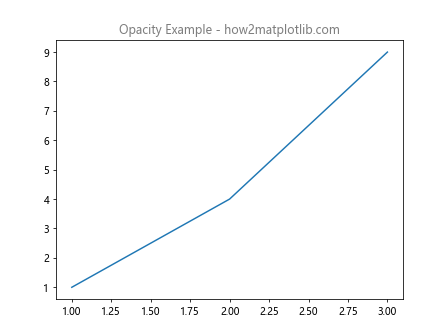
9. 设置透明度
通过设置标题的透明度,可以达到柔和或者强调的视觉效果。
import matplotlib.pyplot as plt

fig, ax = plt.subplots()
ax.plot([1, 2, 3], [1, 4, 9])
ax.set_title('Opacity Example - how2matplotlib.com', alpha=0.5)
plt.show()
Output:
10. 结合使用多种样式
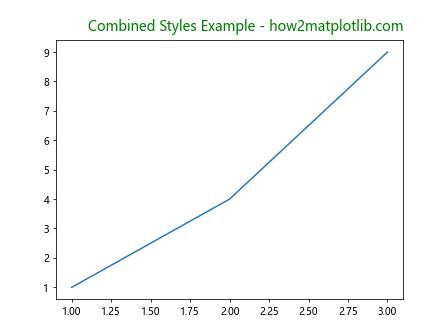
最后,我们可以将多种样式组合使用,以创造出更加个性化和专业的图表标题。
import matplotlib.pyplot as plt

fig, ax = plt.subplots()
ax.plot([1, 2, 3], [1, 4, 9])
ax.set_title('Combined Styles Example - how2matplotlib.com', fontsize=14, color='green', style='italic', loc='right', pad=10)
plt.show()
Output:
以上就是在Matplotlib中设置坐标轴标题的各种方法和技巧。通过这些示例代码,读者可以学习如何根据自己的需求调整和美化图表的标题。
 极客教程
极客教程