ax.annotate
参考:Ax Annotate
在matplotlib中,ax.annotate是一个用于在图表中添加注释的非常有用的函数。它可以在图表中的任意位置添加文本注释,并且支持自定义注释的样式和位置。本文将详细介绍ax.annotate函数的用法,包括基本用法、自定义样式、添加箭头等技巧。
基本用法
首先我们来看一下ax.annotate函数的基本用法,其语法如下:
ax.annotate(s, xy, xytext, arrowprops=None)
其中各参数的含义如下:
– s:要添加的注释文本
– xy:注释的目标点位置
– xytext:注释文本的位置
– arrowprops:箭头的属性
下面是一个简单的示例代码,演示如何在图表中添加一条注释:
import matplotlib.pyplot as plt

fig, ax = plt.subplots()
ax.plot([1, 2, 3, 4], [1, 4, 9, 16])

ax.annotate('Example Annotation', (2, 8))

plt.show()
Output:
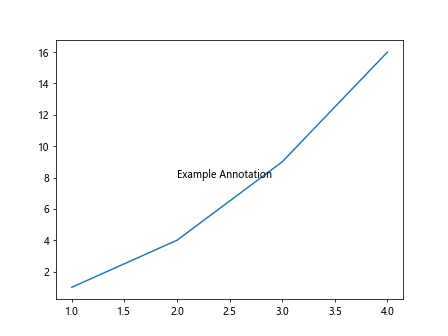
运行以上代码,可以看到在图表中的坐标 (2, 8) 处添加了一条注释 “Example Annotation”。
自定义样式
除了基本的用法之外,我们还可以通过一些参数来自定义注释的样式。例如可以设置注释框的背景颜色、边框粗细等。下面是一个示例代码,演示如何自定义注释的样式:
import matplotlib.pyplot as plt

fig, ax = plt.subplots()
ax.plot([1, 2, 3, 4], [1, 4, 9, 16])

ax.annotate('Custom Annotation',
            xy=(3, 9), xytext=(2, 10),
            arrowprops=dict(facecolor='green', edgecolor='red', shrink=0.05))

plt.show()
Output:
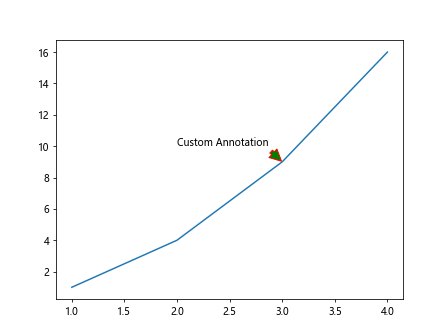
运行以上代码,可以看到在图表中的坐标 (3, 9) 处添加了一条注释 “Custom Annotation”,并且自定义了注释框的背景颜色为绿色,边框颜色为红色。
添加箭头
在ax.annotate函数中,可以通过设置arrowprops参数来添加箭头,并调整箭头的属性。下面是一个示例代码,演示如何在注释中添加箭头:
import matplotlib.pyplot as plt

fig, ax = plt.subplots()
ax.plot([1, 2, 3, 4], [1, 4, 9, 16])

ax.annotate('Annotation with Arrow',
            xy=(2, 8), xytext=(3, 12),
            arrowprops=dict(arrowstyle='->', connectionstyle='arc3', color='blue'))

plt.show()
Output:
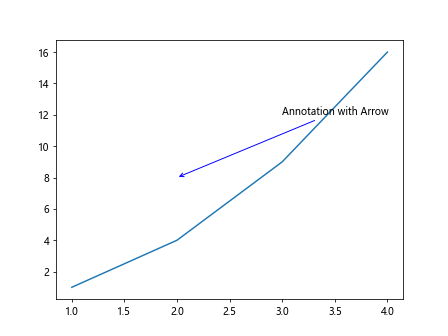
运行以上代码,可以看到在图表中的坐标 (2, 8) 处添加了一条带有箭头的注释 “Annotation with Arrow”。
改变注释文本的位置
在ax.annotate函数中,xytext参数控制了注释文本的位置,默认情况下注释都是在xy指定的坐标位置上显示。我们可以通过调整xytext参数来改变注释文本的位置。下面是一个示例代码,演示如何改变注释文本的位置:
import matplotlib.pyplot as plt

fig, ax = plt.subplots()
ax.plot([1, 2, 3, 4], [1, 4, 9, 16])

ax.annotate('Custom Text Position',
            xy=(3, 9), xytext=(3.5, 10))

plt.show()
Output:
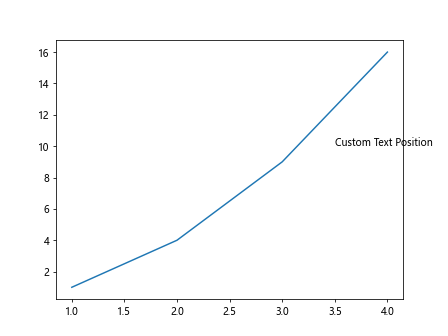
运行以上代码,可以看到注释文本 “Custom Text Position” 的位置被改变到了 (3.5, 10)。
控制文本的对齐方式
在ax.annotate函数中,可以通过设置horizontalalignment和verticalalignment参数来控制注释文本的水平和垂直对齐方式。下面是一个示例代码,演示如何控制文本的对齐方式:
import matplotlib.pyplot as plt

fig, ax = plt.subplots()
ax.plot([1, 2, 3, 4], [1, 4, 9, 16])

ax.annotate('Alignment Example',
            xy=(2, 8), xytext=(2.5, 9),
            arrowprops=dict(arrowstyle='->'),
            horizontalalignment='right', verticalalignment='top')

plt.show()
Output:
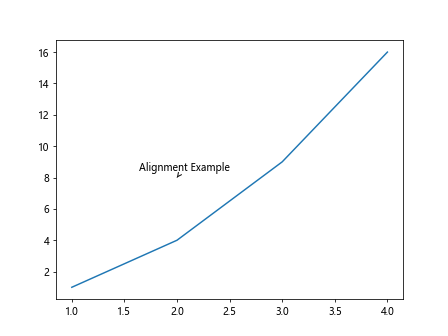
运行以上代码,可以看到注释文本 “Alignment Example” 的水平对齐方式为右对齐,垂直对齐方式为顶部对齐。
控制注释文本的字体样式
在ax.annotate函数中,可以通过设置fontdict参数来控制注释文本的字体样式,包括字体大小、颜色等。下面是一个示例代码,演示如何控制注释文本的字体样式:
import matplotlib.pyplot as plt

fig, ax = plt.subplots()
ax.plot([1, 2, 3, 4], [1, 4, 9, 16])

font_dict = {'family': 'serif', 'color': 'darkred', 'size': 14}
ax.annotate('Custom Font Style',
            xy=(2, 8), xytext=(2, 10),
            arrowprops=dict(arrowstyle='->'),
            fontdict=font_dict)

plt.show()
运行以上代码,可以看到注释文本 “Custom Font Style” 的字体样式被自定义为使用衬线字体、暗红色和字体大小为14。
嵌套多个注释
在一个图表中,我们可以嵌套多个注释,将多个注释显示在同一个位置。下面是一个示例代码,演示如何在一个图表中嵌套多个注释:
import matplotlib.pyplot as plt

fig, ax = plt.subplots()
ax.plot([1, 2, 3, 4], [1, 4, 9, 16])

ax.annotate('First Annotation',
            xy=(3, 9), xytext=(1, 12))

ax.annotate('Second Annotation',
            xy=(3, 9), xytext=(3, 12))

plt.show()
Output:
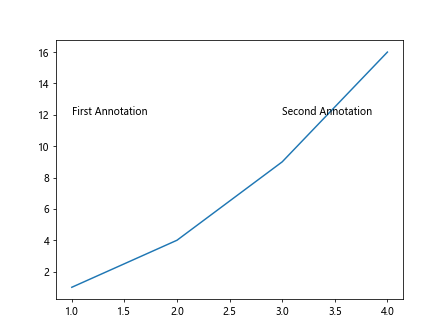
运行以上代码,可以看到在图表中的坐标 (3, 9) 处嵌套了两个注释 “First Annotation” 和 “Second Annotation”。
控制注释文本的背景透明度
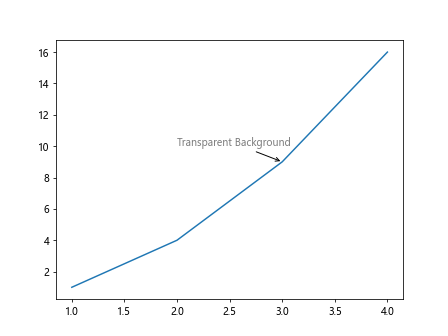
在ax.annotate函数中,可以通过设置alpha参数来控制注释文本的背景透明度。下面是一个示例代码,演示如何控制注释文本的背景透明度:
import matplotlib.pyplot as plt

fig, ax = plt.subplots()
ax.plot([1, 2, 3, 4], [1, 4, 9, 16])

ax.annotate('Transparent Background',
            xy=(3, 9), xytext=(2, 10),
            arrowprops=dict(arrowstyle='->'),
            alpha=0.5)

plt.show()
Output:
运行以上代码,可以看到注释文
“`
文本 “Transparent Background” 的背景被设置为了半透明。
控制箭头的样式和形状
在ax.annotate函数中,可以通过设置arrowprops参数来控制箭头的样式和形状。下面是一个示例代码,演示如何控制箭头的样式和形状:
import matplotlib.pyplot as plt

fig, ax = plt.subplots()
ax.plot([1, 2, 3, 4], [1, 4, 9, 16])

ax.annotate('Custom Arrow Style',
            xy=(2, 8), xytext=(3, 12),
            arrowprops=dict(arrowstyle='->', connectionstyle='angle,angleA=90,angleB=0,rad=10'))

plt.show()
Output:
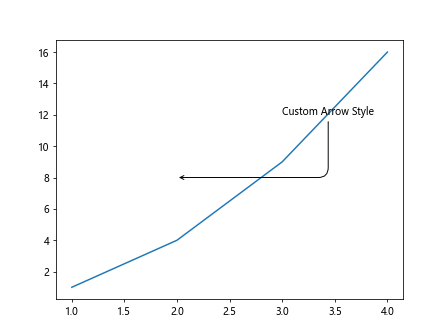
运行以上代码,可以看到箭头的形状被自定义为一个斜向的V形。
控制箭头的长度和方向
在ax.annotate函数中,可以通过设置arrowprops参数的shrink属性来控制箭头的长度和方向。下面是一个示例代码,演示如何控制箭头的长度和方向:
import matplotlib.pyplot as plt

fig, ax = plt.subplots()
ax.plot([1, 2, 3, 4], [1, 4, 9, 16])

ax.annotate('Custom Arrow Shrink',
            xy=(2, 8), xytext=(3, 12),
            arrowprops=dict(arrowstyle='->', shrink=0.1))

plt.show()
运行以上代码,可以看到箭头根据shrink属性的值被缩短了一部分。
控制箭头的颜色和粗细
在ax.annotate函数中,可以通过设置arrowprops参数的color和linewidth属性来控制箭头的颜色和粗细。下面是一个示例代码,演示如何控制箭头的颜色和粗细:
import matplotlib.pyplot as plt

fig, ax = plt.subplots()
ax.plot([1, 2, 3, 4], [1, 4, 9, 16])

ax.annotate('Custom Arrow Color and Width',
            xy=(2, 8), xytext=(3, 12),
            arrowprops=dict(arrowstyle='->', color='purple', linewidth=2))

plt.show()
Output:
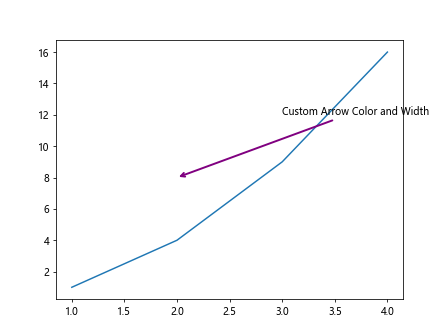
运行以上代码,可以看到箭头的颜色被设置为紫色,粗细为2。
控制箭头的连接方式
在ax.annotate函数中,可以通过设置arrowprops参数的connectionstyle属性来控制箭头的连接方式。下面是一个示例代码,演示如何控制箭头的连接方式:
import matplotlib.pyplot as plt

fig, ax = plt.subplots()
ax.plot([1, 2, 3, 4], [1, 4, 9, 16])

ax.annotate('Custom Arrow Connection',
            xy=(2, 8), xytext=(3, 12),
            arrowprops=dict(arrowstyle='->', connectionstyle='arc3,rad=.5'))

plt.show()
Output:
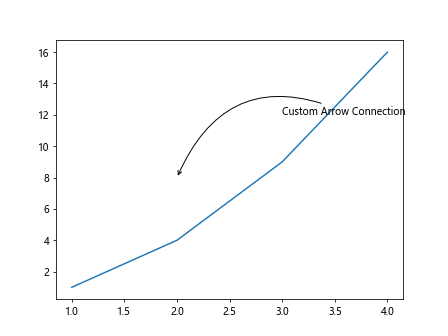
运行以上代码,可以看到箭头连接方式被设置为一个弧形。
控制箭头的长度和角度
在ax.annotate函数中,可以通过设置arrowprops参数的mutation_scale属性来控制箭头的长度和mutation_aspect属性来控制箭头的角度。下面是一个示例代码,演示如何控制箭头的长度和角度:
import matplotlib.pyplot as plt

fig, ax = plt.subplots()
ax.plot([1, 2, 3, 4], [1, 4, 9, 16])

ax.annotate('Custom Arrow Length and Angle',
            xy=(2, 8), xytext=(3, 12),
            arrowprops=dict(arrowstyle='->', mutation_scale=15, mutation_aspect=2))

plt.show()
Output:
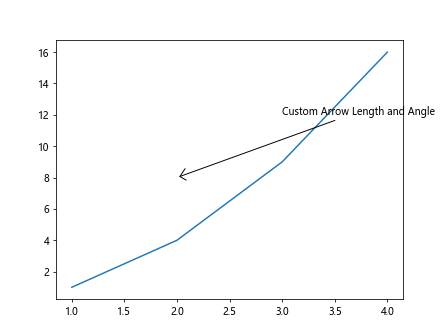
运行以上代码,可以看到箭头的长度被设置为15,角度被设置为2。
控制注释文本和目标点的偏移
在ax.annotate函数中,可以通过设置xycoords和textcoords参数来控制注释文本和目标点的坐标系。以及通过offset_points参数来设置注释文本和目标点的偏移量。下面是一个示例代码,演示如何控制注释文本和目标点的偏移:
import matplotlib.pyplot as plt

fig, ax = plt.subplots()
ax.plot([1, 2, 3, 4], [1, 4, 9, 16])

ax.annotate('Offset Example',
            xy=(2, 8), xytext=(2, 12),
            xycoords='data', textcoords='offset points', offset=(-15, 10),
            arrowprops=dict(arrowstyle='->'))

plt.show()
运行以上代码,可以看到注释文本 “Offset Example” 的位置被设置为目标点的偏移 (-15, 10) 处。
控制注释的边框样式
在ax.annotate函数中,可以通过设置bbox参数来控制注释的边框样式,包括边框的颜色、粗细、透明度等属性。下面是一个示例代码,演示如何控制注释的边框样式:
import matplotlib.pyplot as plt

fig, ax = plt.subplots()
ax.plot([1, 2, 3, 4], [1, 4, 9, 16])

bbox_style = dict(boxstyle='round', facecolor='yellow', edgecolor='blue', linewidth=2, alpha=0.5)
ax.annotate('Box Style Example',
            xy=(2, 8), xytext=(3, 12),
            bbox=bbox_style,
            arrowprops=dict(arrowstyle='->'))

plt.show()
Output:
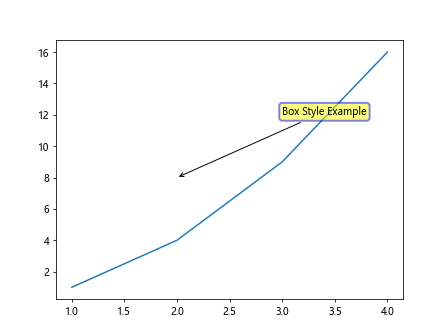
运行以上代码,可以看到注释文本 “Box Style Example” 的边框样式被设置为圆形,背景颜色为黄色,边框颜色为蓝色,粗细为2。
控制注释文本的旋转角度
在ax.annotate函数中,可以通过设置rotation参数来控制注释文本的旋转角度。下面是一个示例代码,演示如何控制注释文本的旋转角度:
import matplotlib.pyplot as plt

fig, ax = plt.subplots()
ax.plot([1, 2, 3, 4], [1, 4, 9, 16])

ax.annotate('Rotate Example',
            xy=(2, 8), xytext=(2, 10),
            arrowprops=dict(arrowstyle='->'),
            rotation=45)

plt.show()
Output:
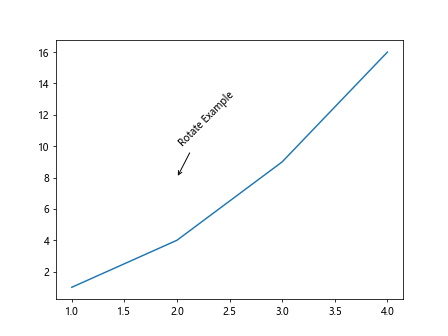
运行以上代码,可以看到注释文本 “Rotate Example” 被旋转了45度。
通过上述示例代码,我们详细介绍了ax.annotate函数的各种用法,包括基本用法、自定义样式、添加箭头等方面。
 极客教程
极客教程