在Matplotlib中添加图形纹理
参考: Adding textures to graphs using Matplotlib
在数据可视化中,使用纹理可以帮助区分图表中的不同部分,尤其是在打印黑白文档或为色盲用户设计图表时。Matplotlib是一个强大的Python图表库,它支持在图表中添加纹理。本文将详细介绍如何在Matplotlib中使用纹理来增强图表的视觉效果。
1. Matplotlib基础
在深入了解如何在Matplotlib中添加纹理之前,我们首先需要安装并导入必要的库。
import matplotlib.pyplot as plt
import numpy as np
2. 纹理的基本应用
在Matplotlib中,纹理通常通过设置hatch属性来实现,该属性可以添加到条形图、饼图、填充区域等多种图形中。
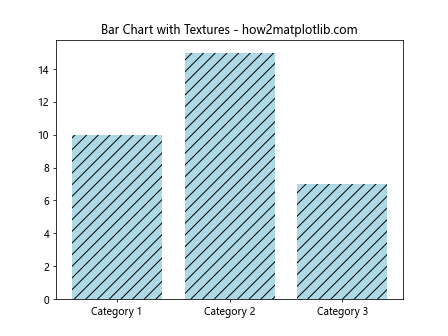
示例1: 纹理在条形图中的应用
import matplotlib.pyplot as plt
import numpy as np

# 数据准备
categories = ['Category 1', 'Category 2', 'Category 3']
values = [10, 15, 7]

fig, ax = plt.subplots()
bars = ax.bar(categories, values, color='lightblue', hatch='//')
ax.set_title('Bar Chart with Textures - how2matplotlib.com')
plt.show()
Output:
示例2: 在饼图中使用纹理
import matplotlib.pyplot as plt
import numpy as np

# 数据准备
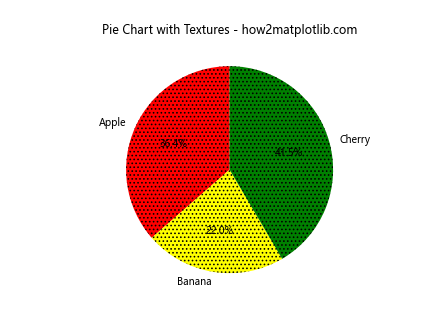
labels = ['Apple', 'Banana', 'Cherry']
sizes = [215, 130, 245]

fig, ax = plt.subplots()
ax.pie(sizes, labels=labels, autopct='%1.1f%%', startangle=90, colors=['red', 'yellow', 'green'],
       wedgeprops={'hatch': '...'})
ax.set_title('Pie Chart with Textures - how2matplotlib.com')
plt.show()
Output:
示例3: 在填充区域添加纹理
import matplotlib.pyplot as plt
import numpy as np

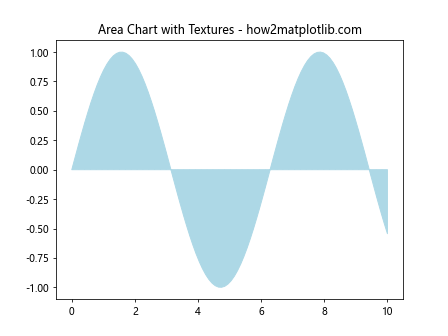
x = np.linspace(0, 10, 100)
y = np.sin(x)

fig, ax = plt.subplots()
ax.fill_between(x, y, color='lightblue', hatch='||')
ax.set_title('Area Chart with Textures - how2matplotlib.com')
plt.show()
Output:
3. 自定义纹理样式
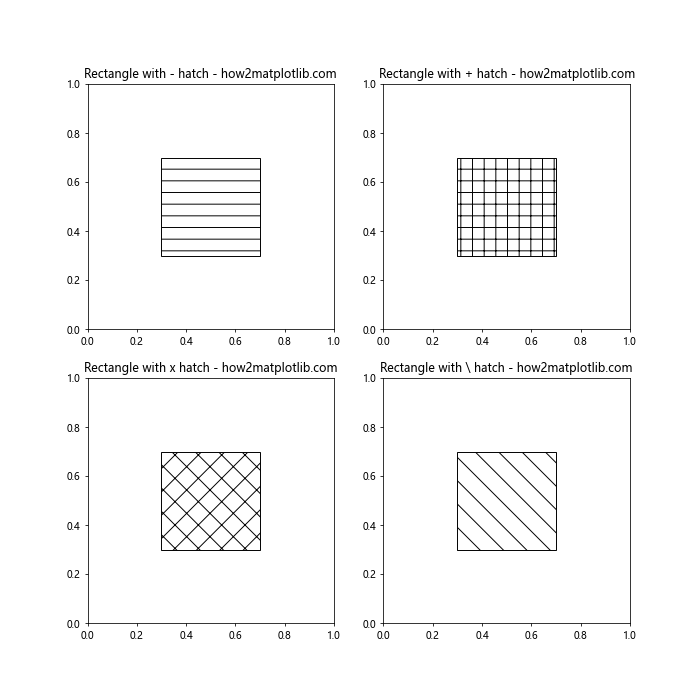
Matplotlib允许用户自定义纹理样式,通过组合不同的线条和符号来创建独特的纹理。
示例4: 组合不同的纹理样式
import matplotlib.pyplot as plt
import numpy as np

fig, axs = plt.subplots(2, 2, figsize=(10, 10))
hatches = ['-', '+', 'x', '\\']

for ax, hatch in zip(axs.ravel(), hatches):
    ax.add_patch(plt.Rectangle((0.3, 0.3), width=0.4, height=0.4, fill=False, hatch=hatch))
    ax.set_title(f'Rectangle with {hatch} hatch - how2matplotlib.com')

plt.show()
Output:
4. 在不同类型的图表中应用纹理
纹理不仅限于某一种图表类型,它可以被应用于多种类型的图表中,增加视觉多样性。
示例5: 在散点图中模拟纹理效果
import matplotlib.pyplot as plt
import numpy as np

x = np.random.rand(50)
y = np.random.rand(50)
colors = np.random.rand(50)
area = np.pi * (15 * np.random.rand(50))**2

fig, ax = plt.subplots()
scatter = ax.scatter(x, y, s=area, c=colors, alpha=0.5)
ax.set_title('Simulated Textures in Scatter Plot - how2matplotlib.com')
plt.show()
Output:
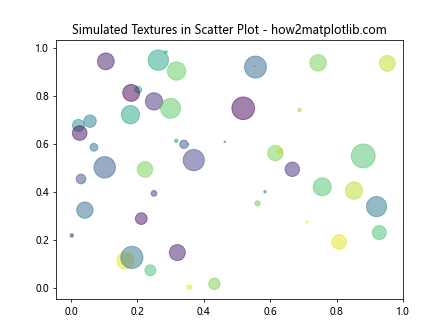
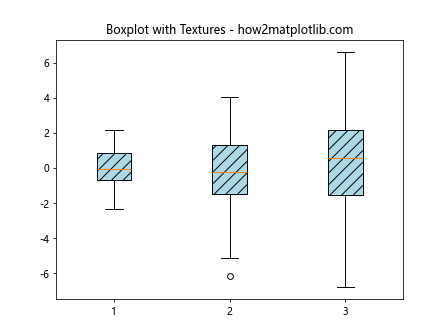
示例6: 在箱形图中使用纹理
import matplotlib.pyplot as plt
import numpy as np

data = [np.random.normal(0, std, 100) for std in range(1, 4)]

fig, ax = plt.subplots()
ax.boxplot(data, patch_artist=True,
           boxprops=dict(facecolor='lightblue', hatch='//'))
ax.set_title('Boxplot with Textures - how2matplotlib.com')
plt.show()
Output:
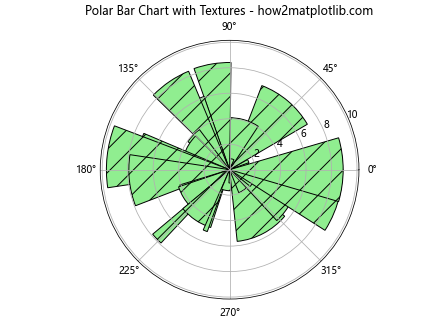
示例7: 在极坐标图中使用纹理
import matplotlib.pyplot as plt
import numpy as np

theta = np.linspace(0, 2*np.pi, 30)
radii = 10 * np.random.rand(30)
width = np.pi / 4 * np.random.rand(30)

fig, ax = plt.subplots(subplot_kw={'projection': 'polar'})
bars = ax.bar(theta, radii, width=width, bottom=0.0, color='lightgreen', edgecolor='black', hatch='/')
ax.set_title('Polar Bar Chart with Textures - how2matplotlib.com')
plt.show()
Output:
5. 纹理与颜色的结合使用
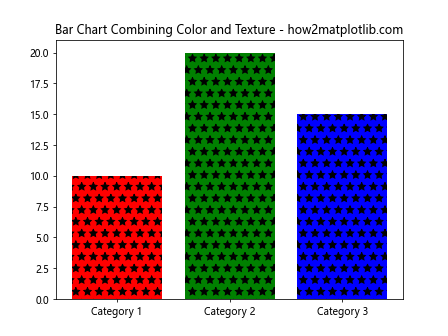
结合纹理和颜色可以进一步增强图表的表现力和信息的可读性。
示例8: 结合纹理和颜色的条形图
import matplotlib.pyplot as plt
import numpy as np

categories = ['Category 1', 'Category 2', 'Category 3']
values = [10, 20, 15]

fig, ax = plt.subplots()
bars = ax.bar(categories, values, color=['red', 'green', 'blue'], hatch='*')
ax.set_title('Bar Chart Combining Color and Texture - how2matplotlib.com')
plt.show()
Output:
6. 高级纹理应用
对于需要更复杂纹理表示的场景,Matplotlib提供了更多的自定义选项。
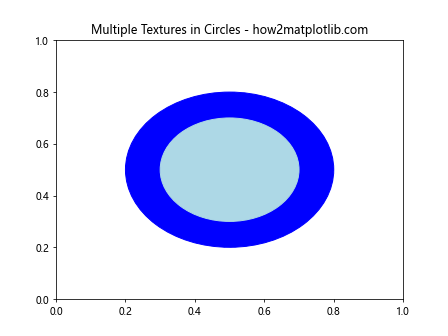
示例9: 使用多重纹理
import matplotlib.pyplot as plt
import numpy as np

fig, ax = plt.subplots()
ax.add_patch(plt.Circle((0.5, 0.5), 0.3, color='blue', hatch='xx'))
ax.add_patch(plt.Circle((0.5, 0.5), 0.2, color='lightblue', hatch='//'))
ax.set_title('Multiple Textures in Circles - how2matplotlib.com')
plt.show()
Output:
示例10: 动态调整纹理密度
import matplotlib.pyplot as plt
import numpy as np

fig, ax = plt.subplots()
for i in range(1, 5):
    ax.add_patch(plt.Rectangle((0.1 * i, 0.1), 0.1, 0.5, hatch='/'*i, fill=None))
ax.set_title('Dynamically Adjusted Texture Density - how2matplotlib.com')
plt.show()
Output:
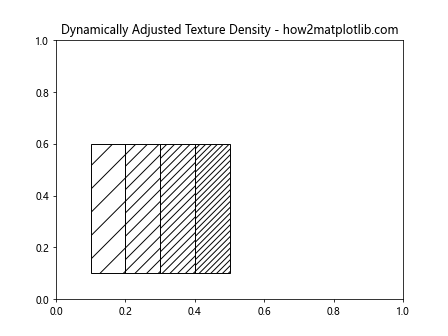
以上示例展示了在Matplotlib中添加纹理的多种方法和技巧。通过合理使用纹理,可以使图表更加生动和易于理解,尤其是在视觉表现上需要区分不同数据集时。
 极客教程
极客教程