在Matplotlib柱状图上添加数值标签
参考: Adding value labels on a matplotlib bar chart
在数据可视化中,柱状图是展示和比较一组数据的有效工具。通过在柱状图上添加数值标签,可以使观众更直观地看到每个柱子的具体数值,从而提供更多的信息和更好的理解。本文将详细介绍如何在使用Matplotlib库时在柱状图上添加数值标签。
1. 基本柱状图的创建
首先,我们需要安装和导入Matplotlib库。如果你还没有安装,可以通过以下命令安装:
pip install matplotlib
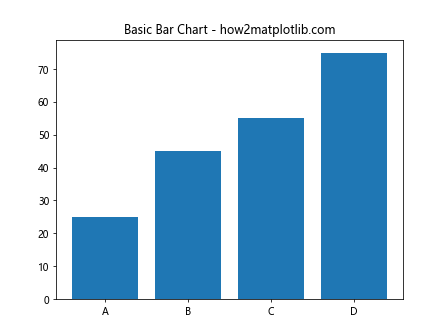
导入Matplotlib库,并创建一个简单的柱状图:
import matplotlib.pyplot as plt

data = [25, 45, 55, 75]
labels = ['A', 'B', 'C', 'D']

plt.bar(labels, data)
plt.title("Basic Bar Chart - how2matplotlib.com")
plt.show()
Output:
2. 在柱状图上添加数值标签
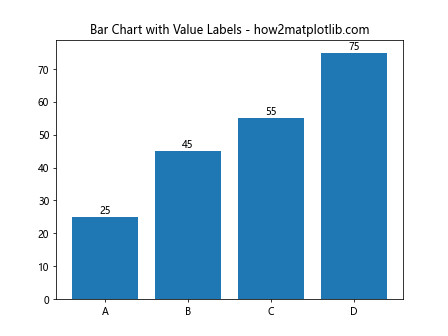
接下来,我们将在每个柱子的顶部添加数值标签,以显示每个柱子的具体数值。
import matplotlib.pyplot as plt

data = [25, 45, 55, 75]
labels = ['A', 'B', 'C', 'D']

fig, ax = plt.subplots()
bars = ax.bar(labels, data)

for bar in bars:
    yval = bar.get_height()
    ax.text(bar.get_x() + bar.get_width()/2, yval, yval, ha='center', va='bottom')

plt.title("Bar Chart with Value Labels - how2matplotlib.com")
plt.show()
Output:
3. 调整标签位置
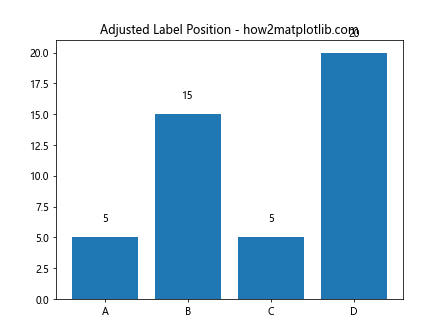
有时候,数值标签直接放在柱子顶部可能会因为柱子太短而难以阅读,我们可以适当调整标签的位置。
import matplotlib.pyplot as plt

data = [5, 15, 5, 20]
labels = ['A', 'B', 'C', 'D']

fig, ax = plt.subplots()
bars = ax.bar(labels, data)

for bar in bars:
    yval = bar.get_height()
    ax.text(bar.get_x() + bar.get_width()/2, yval + 1, yval, ha='center', va='bottom')

plt.title("Adjusted Label Position - how2matplotlib.com")
plt.show()
Output:
4. 格式化数值标签
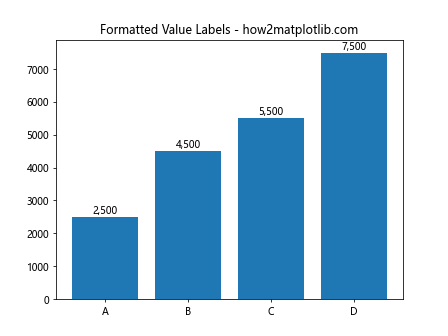
我们可以格式化数值标签,使其更具可读性,例如添加千位分隔符或者限制小数点后的位数。
import matplotlib.pyplot as plt

data = [2500, 4500, 5500, 7500]
labels = ['A', 'B', 'C', 'D']

fig, ax = plt.subplots()
bars = ax.bar(labels, data)

for bar in bars:
    yval = bar.get_height()
    ax.text(bar.get_x() + bar.get_width()/2, yval, f'{yval:,}', ha='center', va='bottom')

plt.title("Formatted Value Labels - how2matplotlib.com")
plt.show()
Output:
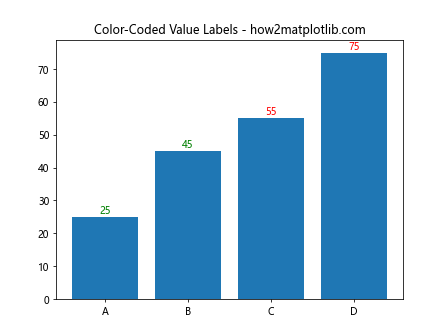
5. 不同颜色的数值标签
为了使图表更加多彩,我们可以根据柱子的高度给数值标签设置不同的颜色。
import matplotlib.pyplot as plt

data = [25, 45, 55, 75]
labels = ['A', 'B', 'C', 'D']

fig, ax = plt.subplots()
bars = ax.bar(labels, data)

for bar in bars:
    yval = bar.get_height()
    color = 'red' if yval > 50 else 'green'
    ax.text(bar.get_x() + bar.get_width()/2, yval, yval, ha='center', va='bottom', color=color)

plt.title("Color-Coded Value Labels - how2matplotlib.com")
plt.show()
Output:
6. 旋转数值标签
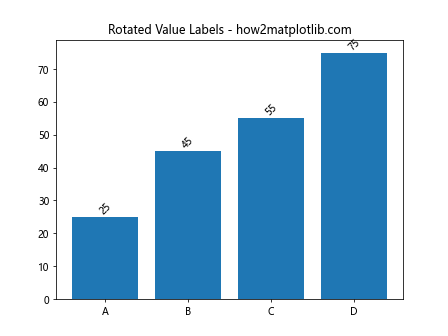
有时候,为了更好地适应空间或提高可读性,我们可能需要旋转数值标标签。
import matplotlib.pyplot as plt

data = [25, 45, 55, 75]
labels = ['A', 'B', 'C', 'D']

fig, ax = plt.subplots()
bars = ax.bar(labels, data)

for bar in bars:
    yval = bar.get_height()
    ax.text(bar.get_x() + bar.get_width()/2, yval, yval, ha='center', va='bottom', rotation=45)

plt.title("Rotated Value Labels - how2matplotlib.com")
plt.show()
Output:
7. 添加背景色和边框
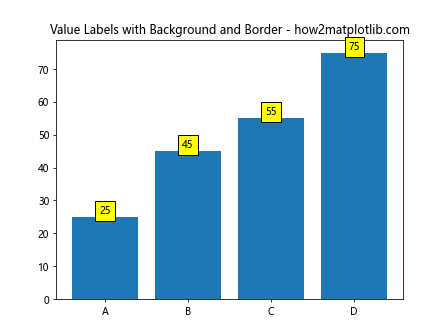
我们还可以为数值标签添加背景色和边框,以增强视觉效果。
import matplotlib.pyplot as plt

data = [25, 45, 55, 75]
labels = ['A', 'B', 'C', 'D']

fig, ax = plt.subplots()
bars = ax.bar(labels, data)

for bar in bars:
    yval = bar.get_height()
    ax.text(bar.get_x() + bar.get_width()/2, yval, yval, ha='center', va='bottom', bbox=dict(facecolor='yellow', edgecolor='black'))

plt.title("Value Labels with Background and Border - how2matplotlib.com")
plt.show()
Output:
8. 使用不同的字体和大小
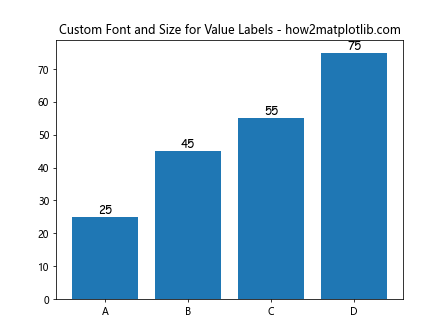
为了使图表更具个性化,我们可以更改数值标签的字体和大小。
import matplotlib.pyplot as plt

data = [25, 45, 55, 75]
labels = ['A', 'B', 'C', 'D']

fig, ax = plt.subplots()
bars = ax.bar(labels, data)

for bar in bars:
    yval = bar.get_height()
    ax.text(bar.get_x() + bar.get_width()/2, yval, yval, ha='center', va='bottom', fontname='Comic Sans MS', fontsize=12)

plt.title("Custom Font and Size for Value Labels - how2matplotlib.com")
plt.show()
Output:
9. 结合其他图表类型
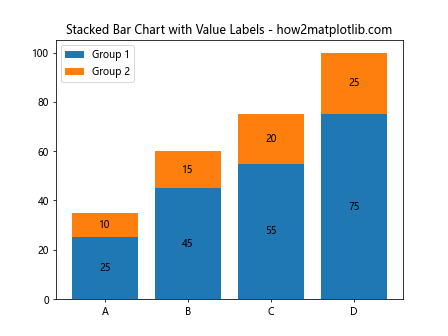
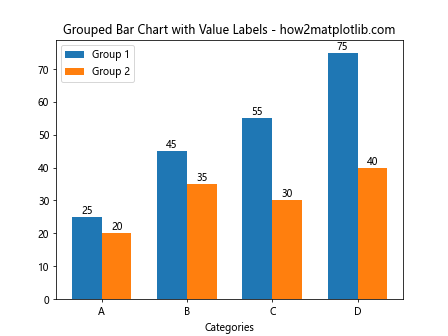
数值标签不仅可以用在纯柱状图上,也可以与其他图表类型结合使用,如堆叠柱状图、分组柱状图等。
9.1 堆叠柱状图
import matplotlib.pyplot as plt

data1 = [25, 45, 55, 75]
data2 = [10, 15, 20, 25]
labels = ['A', 'B', 'C', 'D']

fig, ax = plt.subplots()
bars1 = ax.bar(labels, data1, label='Group 1')
bars2 = ax.bar(labels, data2, bottom=data1, label='Group 2')

for bars in [bars1, bars2]:
    for bar in bars:
        yval = bar.get_height()
        ax.text(bar.get_x() + bar.get_width()/2, bar.get_y() + yval/2, yval, ha='center', va='center')

plt.title("Stacked Bar Chart with Value Labels - how2matplotlib.com")
plt.legend()
plt.show()
Output:
9.2 分组柱状图
import numpy as np
import matplotlib.pyplot as plt

# 数据
data1 = [25, 45, 55, 75]
data2 = [20, 35, 30, 40]
labels = ['A', 'B', 'C', 'D']

x = np.arange(len(labels))  # 标签位置
width = 0.35  # 柱的宽度

fig, ax = plt.subplots()
bars1 = ax.bar(x - width/2, data1, width, label='Group 1')
bars2 = ax.bar(x + width/2, data2, width, label='Group 2')

# 添加数值标签
for bars in [bars1, bars2]:
    for bar in bars:
        yval = bar.get_height()
        ax.text(bar.get_x() + bar.get_width()/2, yval, yval, ha='center', va='bottom')

ax.set_xlabel('Categories')
ax.set_title('Grouped Bar Chart with Value Labels - how2matplotlib.com')
ax.set_xticks(x)
ax.set_xticklabels(labels)
ax.legend()

plt.show()
Output:
10. 结论
在Matplotlib中添加数值标签到柱状图是一个简单而有效的方法,可以增强图表的信息表达能力和观众的理解。通过本文的示例,我们学习了如何创建基本的柱状图,如何在柱状图上添加和格式化数值标签,以及如何将数值标签应用于不同类型的柱状图,包括堆叠柱状图和分组柱状图。
 极客教程
极客教程