在Matplotlib中使用scatter()添加图例到3D散点图
参考: Add a legend in a 3D scatterplot with scatter() in Matplotlib
在数据可视化的过程中,3D散点图是一种非常有效的方式来展示三维数据集的分布。Matplotlib库提供了强大的工具来创建和定制这样的图表。本文将详细介绍如何在Matplotlib中使用scatter()函数创建3D散点图,并特别关注如何添加图例来提高图表的可读性和信息传递效率。
1. Matplotlib和3D图的基础
Matplotlib是一个广泛使用的Python绘图库,它支持多种静态、动态和交互式的图表。为了创建3D图形,Matplotlib提供了mpl_toolkits.mplot3d模块,该模块能够支持基本的3D绘图功能,包括3D散点图。
示例代码1:导入必要的库
import matplotlib.pyplot as plt
from mpl_toolkits.mplot3d import Axes3D
import numpy as np
2. 创建基本的3D散点图
创建3D散点图的第一步是生成数据。我们通常使用NumPy库来生成或操作数据。
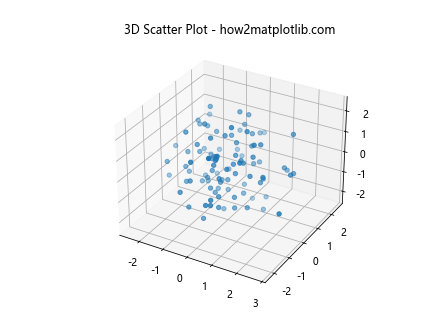
示例代码2:生成随机数据并绘制3D散点图
import matplotlib.pyplot as plt
from mpl_toolkits.mplot3d import Axes3D
import numpy as np

fig = plt.figure()
ax = fig.add_subplot(111, projection='3d')
x = np.random.standard_normal(100)
y = np.random.standard_normal(100)
z = np.random.standard_normal(100)
ax.scatter(x, y, z)
ax.set_title("3D Scatter Plot - how2matplotlib.com")
plt.show()
Output:
3. 向3D散点图添加图例
图例是图表中用来标示不同数据系列的文本框。在3D散点图中添加图例可以帮助观众更好地理解数据的分类或分布情况。
示例代码3:添加单个图例
import matplotlib.pyplot as plt
from mpl_toolkits.mplot3d import Axes3D
import numpy as np

fig = plt.figure()
ax = fig.add_subplot(111, projection='3d')
x = np.random.standard_normal(100)
y = np.random.standard_normal(100)
z = np.random.standard_normal(100)
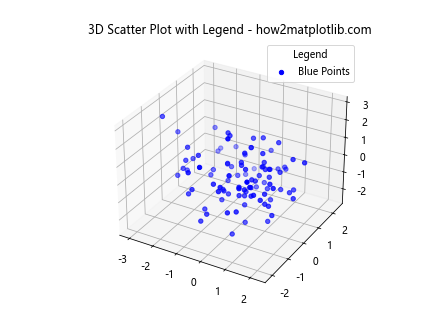
scatter = ax.scatter(x, y, z, color='b', label='Blue Points')
ax.legend(title="Legend")
ax.set_title("3D Scatter Plot with Legend - how2matplotlib.com")
plt.show()
Output:
示例代码4:添加多个图例
import matplotlib.pyplot as plt
from mpl_toolkits.mplot3d import Axes3D
import numpy as np

fig = plt.figure()
ax = fig.add_subplot(111, projection='3d')
x = np.random.standard_normal(100)
y = np.random.standard_normal(100)
z = np.random.standard_normal(100)
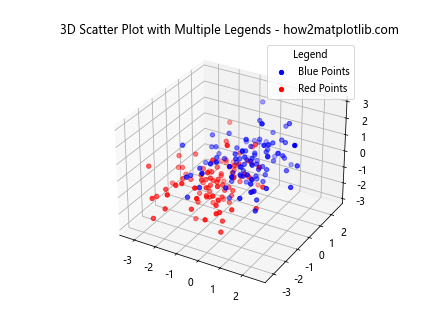
scatter1 = ax.scatter(x, y, z, color='b', label='Blue Points')
scatter2 = ax.scatter(x - 1, y - 1, z - 1, color='r', label='Red Points')
ax.legend(title="Legend")
ax.set_title("3D Scatter Plot with Multiple Legends - how2matplotlib.com")
plt.show()
Output:
4. 定制图例的样式和位置
Matplotlib允许用户定制图例的样式和位置,以适应不同的视觉需求。
示例代码5:改变图例的位置
import matplotlib.pyplot as plt
from mpl_toolkits.mplot3d import Axes3D
import numpy as np

fig = plt.figure()
ax = fig.add_subplot(111, projection='3d')
x = np.random.standard_normal(100)
y = np.random.standard_normal(100)
z = np.random.standard_normal(100)
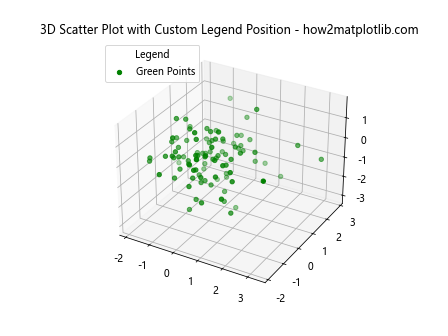
scatter = ax.scatter(x, y, z, color='g', label='Green Points')
ax.legend(loc='upper left', title="Legend")
ax.set_title("3D Scatter Plot with Custom Legend Position - how2matplotlib.com")
plt.show()
Output:
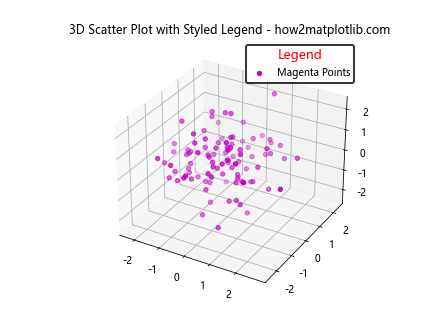
示例代码6:定制图例的字体和边框
import matplotlib.pyplot as plt
from mpl_toolkits.mplot3d import Axes3D
import numpy as np

fig = plt.figure()
ax = fig.add_subplot(111, projection='3d')
x = np.random.standard_normal(100)
y = np.random.standard_normal(100)
z = np.random.standard_normal(100)
scatter = ax.scatter(x, y, z, color='m', label='Magenta Points')
legend = ax.legend(loc='upper right', title="Legend")
legend.get_frame().set_edgecolor('black')
legend.get_frame().set_linewidth(2)
legend.get_title().set_fontsize('13')
legend.get_title().set_color('red')
ax.set_title("3D Scatter Plot with Styled Legend - how2matplotlib.com")
plt.show()
Output:
5. 使用不同的标记和颜色
在3D散点图中,使用不同的标记和颜色可以帮助区分不同的数据点或数据系列。
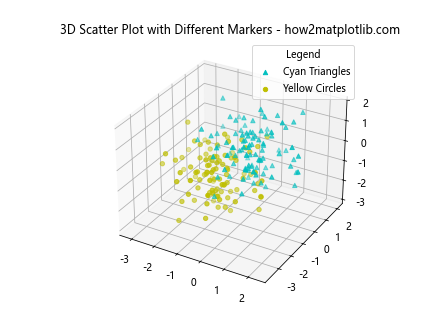
示例代码7:使用不同的标记
import matplotlib.pyplot as plt
from mpl_toolkits.mplot3d import Axes3D
import numpy as np

fig = plt.figure()
ax = fig.add_subplot(111, projection='3d')
x = np.random.standard_normal(100)
y = np.random.standard_normal(100)
z = np.random.standard_normal(100)
scatter1 = ax.scatter(x, y, z, color='c', marker='^', label='Cyan Triangles')
scatter2 = ax.scatter(x - 1, y - 1, z - 1, color='y', marker='o', label='Yellow Circles')
ax.legend(title="Legend")
ax.set_title("3D Scatter Plot with Different Markers - how2matplotlib.com")
plt.show()
Output:
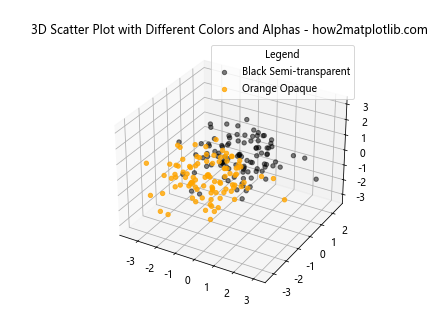
示例代码8:使用不同的颜色和透明度
import matplotlib.pyplot as plt
from mpl_toolkits.mplot3d import Axes3D
import numpy as np

fig = plt.figure()
ax = fig.add_subplot(111, projection='3d')
x = np.random.standard_normal(100)
y = np.random.standard_normal(100)
z = np.random.standard_normal(100)
scatter1 = ax.scatter(x, y, z, color='k', alpha=0.5, label='Black Semi-transparent')
scatter2 = ax.scatter(x - 1, y - 1, z - 1, color='orange', alpha=0.8, label='Orange Opaque')
ax.legend(title="Legend")
ax.set_title("3D Scatter Plot with Different Colors and Alphas - how2matplotlib.com")
plt.show()
Output:
6. 结论
在本文中,我们详细介绍了如何在Matplotlib中使用scatter()函数创建3D散点图,并特别强调了如何添加和定制图例。通过提供的示例代码,读者可以学习如何有效地使用这些技术来提升自己的数据可视化项目。
 极客教程
极客教程