在Matplotlib中使用scatter()添加图例到3D散点图
参考:Add a legend in a 3D scatterplot with scatter() in Matplotlib
在数据可视化的过程中,3D散点图是一种常用的方式来展示三维数据的分布。Matplotlib库提供了强大的工具来创建和定制这类图表。本文将详细介绍如何在Matplotlib中使用scatter()函数创建3D散点图,并特别强调如何添加图例来提高图表的可读性和信息传递效率。
1. Matplotlib和3D图的基础
在开始绘制3D散点图之前,首先需要了解一些基础知识。Matplotlib是一个Python的图形库,它支持多种静态、动态和交互式的图表。为了创建3D图表,我们需要使用Matplotlib的mpl_toolkits.mplot3d模块。
示例代码 1:导入必要的库
import matplotlib.pyplot as plt
from mpl_toolkits.mplot3d import Axes3D
import numpy as np
2. 创建3D散点图
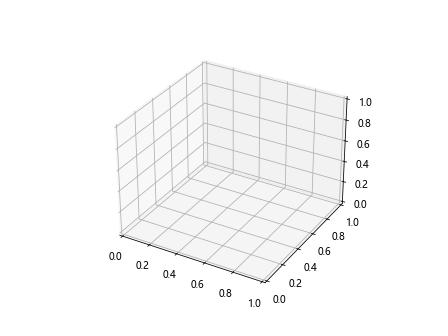
创建3D散点图的第一步是初始化一个3D坐标系。这可以通过在plt.figure()中添加projection='3d'参数来实现。
示例代码 2:初始化3D坐标系
import matplotlib.pyplot as plt
from mpl_toolkits.mplot3d import Axes3D
import numpy as np

fig = plt.figure()
ax = fig.add_subplot(111, projection='3d')
plt.show()
Output:
3. 添加散点
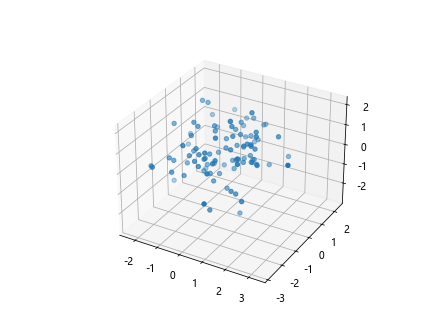
使用scatter()函数可以在3D坐标系中添加散点。这个函数主要接受x, y, z三个坐标值作为输入。
示例代码 3:添加散点
import matplotlib.pyplot as plt
from mpl_toolkits.mplot3d import Axes3D
import numpy as np

fig = plt.figure()
ax = fig.add_subplot(111, projection='3d')
x = np.random.standard_normal(100)
y = np.random.standard_normal(100)
z = np.random.standard_normal(100)
ax.scatter(x, y, z)
plt.show()
Output:
4. 添加图例
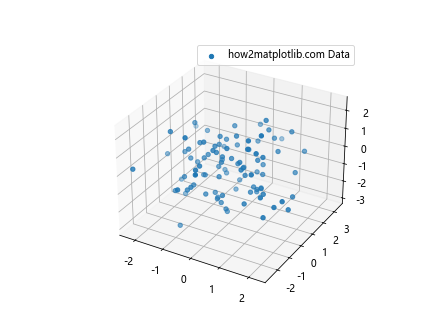
图例是图表中用来标示不同数据系列的文本框。在3D散点图中添加图例可以帮助观众更好地理解数据的分类。
示例代码 4:添加单个图例
import matplotlib.pyplot as plt
from mpl_toolkits.mplot3d import Axes3D
import numpy as np

fig = plt.figure()
ax = fig.add_subplot(111, projection='3d')
x = np.random.standard_normal(100)
y = np.random.standard_normal(100)
z = np.random.standard_normal(100)
scatter = ax.scatter(x, y, z, label='how2matplotlib.com Data')
ax.legend()
plt.show()
Output:
5. 定制图例
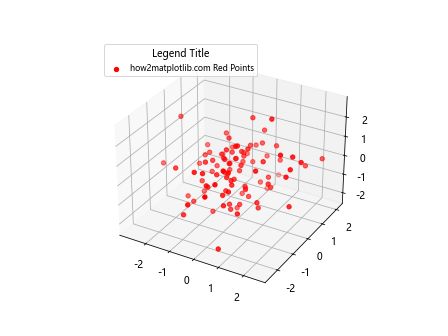
Matplotlib允许用户定制图例的位置和外观,例如修改图例的字体大小、边框和背景色。
示例代码 5:定制图例外观
import matplotlib.pyplot as plt
from mpl_toolkits.mplot3d import Axes3D
import numpy as np

fig = plt.figure()
ax = fig.add_subplot(111, projection='3d')
x = np.random.standard_normal(100)
y = np.random.standard_normal(100)
z = np.random.standard_normal(100)
scatter = ax.scatter(x, y, z, color='r', label='how2matplotlib.com Red Points')
ax.legend(loc='upper left', fontsize='small', title='Legend Title')
plt.show()
Output:
6. 使用不同颜色和标记
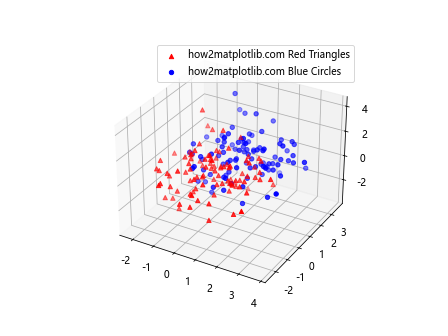
在3D散点图中,使用不同的颜色和标记可以区分不同的数据点。这可以通过传递color和marker参数到scatter()函数来实现。
示例代码 6:使用不同颜色和标记
import matplotlib.pyplot as plt
from mpl_toolkits.mplot3d import Axes3D
import numpy as np

fig = plt.figure()
ax = fig.add_subplot(111, projection='3d')
x = np.random.standard_normal(100)
y = np.random.standard_normal(100)
z = np.random.standard_normal(100)
ax.scatter(x, y, z, color='r', marker='^', label='how2matplotlib.com Red Triangles')
ax.scatter(x+1, y+1, z+1, color='b', marker='o', label='how2matplotlib.com Blue Circles')
ax.legend()
plt.show()
Output:
7. 多个图例
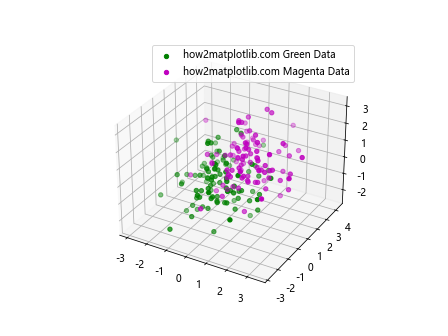
在同一个图表中添加多个图例可以帮助区分更多的数据系列。
示例代码 7:添加多个图例
import matplotlib.pyplot as plt
from mpl_toolkits.mplot3d import Axes3D
import numpy as np

fig = plt.figure()
ax = fig.add_subplot(111, projection='3d')
x = np.random.standard_normal(100)
y = np.random.standard_normal(100)
z = np.random.standard_normal(100)
ax.scatter(x, y, z, color='g', label='how2matplotlib.com Green Data')
ax.scatter(x+1, y+1, z+1, color='m', label='how2matplotlib.com Magenta Data')
ax.legend()
plt.show()
Output:
8. 图例的交互性
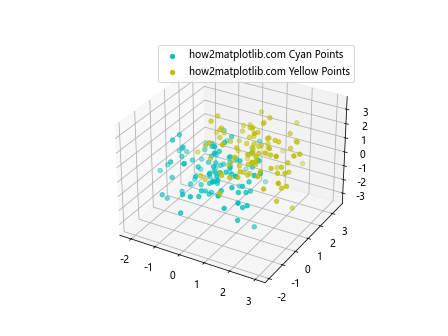
Matplotlib还支持使图例具有交互性,例如点击图例中的标记来显示或隐藏对应的数据系列。
示例代码 8:使图例具有交互性
import matplotlib.pyplot as plt
from mpl_toolkits.mplot3d import Axes3D
import numpy as np

fig = plt.figure()
ax = fig.add_subplot(111, projection='3d')
x = np.random.standard_normal(100)
y = np.random.standard_normal(100)
z = np.random.standard_normal(100)
scatter1 = ax.scatter(x, y, z, color='c', label='how2matplotlib.com Cyan Points')
scatter2 = ax.scatter(x+1, y+1, z+1, color='y', label='how2matplotlib.com Yellow Points')

legend = ax.legend()
legend.get_texts()[0].set_picker(True)
legend.get_texts()[1].set_picker(True)

def on_pick(event):
    legtext = event.artist
    orig_color = legtext.get_color()
    if orig_color == 'black':
        legtext.set_color(orig_color)
    else:
        legtext.set_color('black')
    fig.canvas.draw()

fig.canvas.mpl_connect('pick_event', on_pick)
plt.show()
Output:
9. 结论
通过本文的介绍,我们学习了如何在Matplotlib中创建3D散点图,并通过添加图例来增强图表的信息表达能力。通过提供的示例代码,读者可以更好地理解如何使用Matplotlib的功能来创建和定制自己的3D散点图。
 极客教程
极客教程