Matplotlib semilog

在数据可视化中,matplotlib 是一个非常强大的库,可以用来创建各种类型的图表。其中,semilog 图表是一种特殊的图表类型,它使用对数刻度来显示数据。在本文中,我们将详细介绍如何使用 matplotlib 创建 semilog 图表,并提供一些示例代码来帮助您更好地理解这个概念。
1. 创建简单的 semilog 图表
首先,让我们来创建一个简单的 semilog 图表,展示一个正弦函数在对数刻度下的变化。我们可以使用 plt.semilogy() 函数来实现这个功能。
import matplotlib.pyplot as plt
import numpy as np

x = np.linspace(0.1, 10, 100)
y = np.sin(x)

plt.semilogy(x, y)
plt.title('Semilog Plot of Sin Function')
plt.xlabel('x')
plt.ylabel('sin(x)')
plt.show()
代码运行结果:
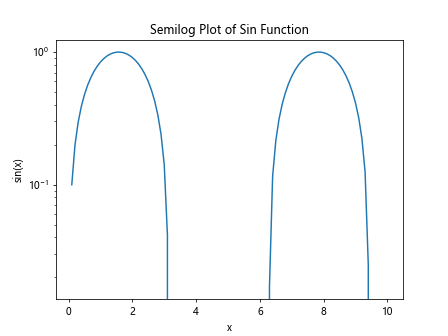
在这个示例中,我们生成了一个从 0.1 到 10 的 x 值序列,并计算了对应的正弦函数值。然后,我们使用 plt.semilogy() 函数将这些数据绘制成一个 semilog 图表。
2. 自定义 semilog 图表的样式
除了基本的 semilog 图表外,我们还可以通过自定义样式来美化图表。例如,我们可以设置线条的颜色、线型和标记样式。
import matplotlib.pyplot as plt
import numpy as np

x = np.linspace(0.1, 10, 100)
y = np.cos(x)

plt.semilogy(x, y, color='red', linestyle='--', marker='o', label='cos(x)')
plt.title('Customized Semilog Plot')
plt.xlabel('x')
plt.ylabel('cos(x)')
plt.legend()
plt.show()
代码运行结果:
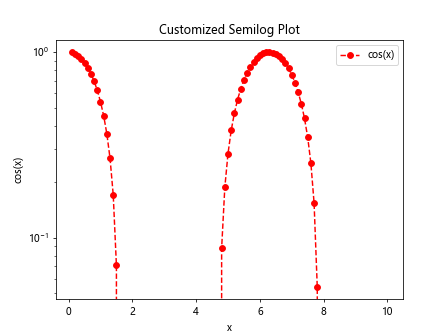
在这个示例中,我们使用了 color='red'、linestyle='--' 和 marker='o' 来设置线条的颜色、线型和标记样式。同时,我们还添加了图例来标识不同的数据系列。
3. 绘制多个 semilog 图表
有时候,我们需要在同一个图表中绘制多个 semilog 图表,以便进行比较。我们可以使用 plt.subplot() 函数来实现这个功能。
import matplotlib.pyplot as plt
import numpy as np

x = np.linspace(0.1, 10, 100)
y1 = np.exp(x)
y2 = np.log(x)

plt.subplot(2, 1, 1)
plt.semilogy(x, y1, color='blue', label='exp(x)')
plt.title('Multiple Semilog Plots')
plt.xlabel('x')
plt.ylabel('exp(x)')
plt.legend()

plt.subplot(2, 1, 2)
plt.semilogy(x, y2, color='green', label='log(x)')
plt.xlabel('x')
plt.ylabel('log(x)')
plt.legend()

plt.tight_layout()
plt.show()
代码运行结果:
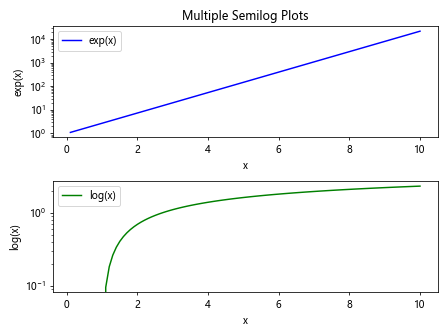
在这个示例中,我们使用了 plt.subplot(2, 1, 1) 来创建一个包含两个子图的图表,然后在每个子图中绘制了不同的 semilog 图表。
4. 使用 semilogx 和 semilogy 绘制半对数坐标轴
除了 plt.semilogy() 外,我们还可以使用 plt.semilogx() 和 plt.semilogy() 分别绘制 x 轴和 y 轴为对数刻度的图表。
import matplotlib.pyplot as plt
import numpy as np

x = np.linspace(0.1, 10, 100)
y = np.power(2, x)

plt.semilogx(x, y, color='purple', label='2^x')
plt.title('Semilogx Plot')
plt.xlabel('x')
plt.ylabel('2^x')
plt.legend()
plt.show()
代码运行结果:
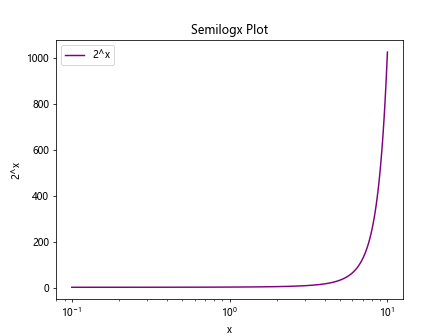
在这个示例中,我们使用了 plt.semilogx() 函数来绘制 x 轴为对数刻度的图表,展示了指数函数的增长趋势。
5. 绘制多个 semilog 图表并设置坐标轴范围
有时候,我们需要在同一个图表中绘制多个 semilog 图表,并设置不同的坐标轴范围。我们可以使用 plt.xlim() 和 plt.ylim() 函数来实现这个功能。
import matplotlib.pyplot as plt
import numpy as np

x = np.linspace(0.1, 10, 100)
y1 = np.exp(x)
y2 = np.log(x)

plt.semilogy(x, y1, color='blue', label='exp(x)')
plt.semilogy(x, y2, color='green', label='log(x)')
plt.title('Multiple Semilog Plots with Custom Axis Limits')
plt.xlabel('x')
plt.ylabel('y')
plt.legend()
plt.xlim(0, 10)
plt.ylim(0.1, 1000)
plt.show()
代码运行结果:
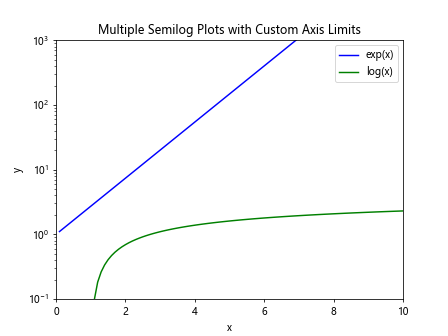
在这个示例中,我们在同一个图表中绘制了两个 semilog 图表,并使用 plt.xlim(0, 10) 和 plt.ylim(0.1, 1000) 来设置 x 轴和 y 轴的范围。
6. 使用 semilogx 和 semilogy 绘制双对数坐标轴
除了绘制半对数坐标轴外,我们还可以使用 plt.loglog() 函数来绘制双对数坐标轴的图表,即 x 轴和 y 轴都为对数刻度。
import matplotlib.pyplot as plt
import numpy as np

x = np.linspace(0.1, 10, 100)
y = np.power(10, x)

plt.loglog(x, y, color='orange', label='10^x')
plt.title('Loglog Plot')
plt.xlabel('x')
plt.ylabel('10^x')
plt.legend()
plt.show()
代码运行结果:
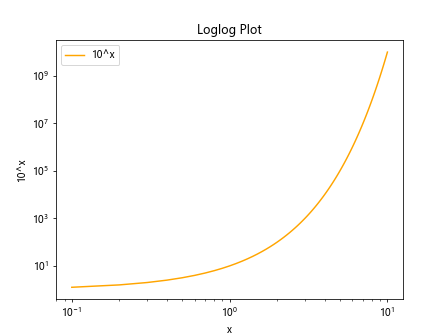
在这个示例中,我们使用了 plt.loglog() 函数来绘制双对数坐标轴的图表,展示了指数函数的增长趋势。
7. 绘制带误差线的 semilog 图表
有时候,我们需要在 semilog 图表中添加误差线,以展示数据的不确定性。我们可以使用 plt.errorbar() 函数来实现这个功能。
import matplotlib.pyplot as plt
import numpy as np

x = np.linspace(0.1, 10, 100)
y = np.log(x)
error = 0.1 * y
error = np.abs(error)  # Ensure error values are non-negative

plt.errorbar(x, y, yerr=error, fmt='o', color='magenta', label='log(x) with Error Bars')
plt.title('Semilog Plot with Error Bars')
plt.xlabel('x')
plt.ylabel('log(x)')
plt.legend()
plt.show()
代码运行结果:
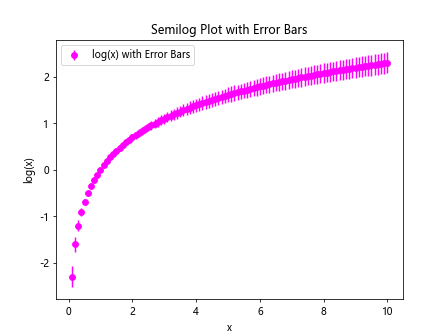
在这个示例中,我们使用了 plt.errorbar() 函数来绘制带误差线的 semilog 图表,展示了数据的不确定性。
8. 绘制带填充区域的 semilog 图表
除了误差线外,我们还可以在 semilog 图表中添加填充区域,以突出数据的范围。我们可以使用 plt.fill_between() 函数来实现这个功能。
import matplotlib.pyplot as plt
import numpy as np

x = np.linspace(0.1, 10, 100)
y1 = np.exp(x)
y2 = np.log(x)

plt.semilogy(x, y1, color='blue', label='exp(x)')
plt.semilogy(x, y2, color='green', label='log(x)')
plt.fill_between(x, y1, y2, color='gray', alpha=0.5)
plt.title('Semilog Plot with Filled Area')
plt.xlabel('x')
plt.ylabel('y')
plt.legend()
plt.show()
代码运行结果:
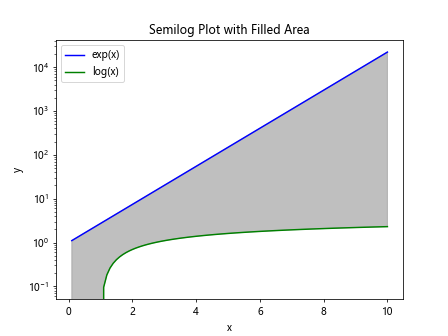
在这个示例中,我们使用了 plt.fill_between() 函数来在 semilog 图表中添加了填充区域,突出了两个数据系列之间的范围。
9. 使用 semilogx 和 semilogy 绘制多个子图
有时候,我们需要在同一个图表中绘制多个子图,并且每个子图都是 semilog 图表。我们可以使用 plt.subplots() 函数来实现这个功能。
import matplotlib.pyplot as plt
import numpy as np

x = np.linspace(0.1, 10, 100)
y1 = np.exp(x)
y2 = np.log(x)

fig, axs = plt.subplots(2, 2, figsize=(10, 8))

axs[0, 0].semilogx(x, y1, color='blue', label='exp(x)')
axs[0, 0].set_title('Semilogx Plot 1')
axs[0, 0].set_xlabel('x')
axs[0, 0].set_ylabel('exp(x)')
axs[0, 0].legend()

axs[0, 1].semilogx(x, y2, color='green', label='log(x)')
axs[0, 1].set_title('Semilogx Plot 2')
axs[0, 1].set_xlabel('x')
axs[0, 1].set_ylabel('log(x)')
axs[0, 1].legend()

axs[1, 0].semilogy(x, y1, color='blue', label='exp(x)')
axs[1, 0].set_title('Semilogy Plot 1')
axs[1, 0].set_xlabel('x')
axs[1, 0].set_ylabel('exp(x)')
axs[1, 0].legend()

axs[1, 1].semilogy(x, y2, color='green', label='log(x)')
axs[1, 1].set_title('Semilogy Plot 2')
axs[1, 1].set_xlabel('x')
axs[1, 1].set_ylabel('log(x)')
axs[1, 1].legend()

plt.tight_layout()
plt.show()
代码运行结果:
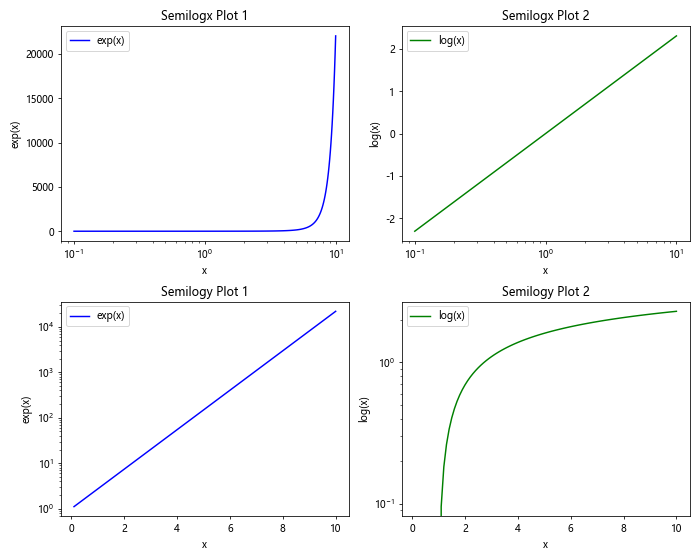
在这个示例中,我们使用了 plt.subplots() 函数创建了一个包含多个子图的图表,并在每个子图中绘制了不同类型的 semilog 图表。
10. 结论
通过本文的介绍和示例代码,您应该已经了解了如何使用 matplotlib 创建 semilog 图表,并对 semilog 图表的应用有了更深入的理解。
 极客教程
极客教程