从数据帧中删除NaN值而不使用fillna或Interpolate(Python Matplotlib)
为了删除数据框中的NaN值而不使用filter或interpolate,我们可以采取以下步骤:
步骤
- 设置图形大小并调整子图周围和之间的填充。
-
创建一个数组以创建Pandas数据框。
-
具有轴标签(包括时间序列)的一维 ndarray 。
-
绘制插值, ‘index’ , ‘values’ - 使用指数的实际数值。
-
使用 show() 方法来显示图表。
示例
import numpy as np
import pandas as pd
from matplotlib import pyplot as plt

# Set the figure size
plt.rcParams["figure.figsize"] = [7.50, 3.50]
plt.rcParams["figure.autolayout"] = True

# Numpy array
data = np.array([1., 1.2, 0.89, np.NAN,
   1.2, np.NAN, 1.89, 2.09,
   .78, .67, np.NAN, 1.78,
   np.NAN, 1.56, 1.89, 2.78]
   )

# Pandas dataframe
df = pd.Series(data)

# Plot the interpolation
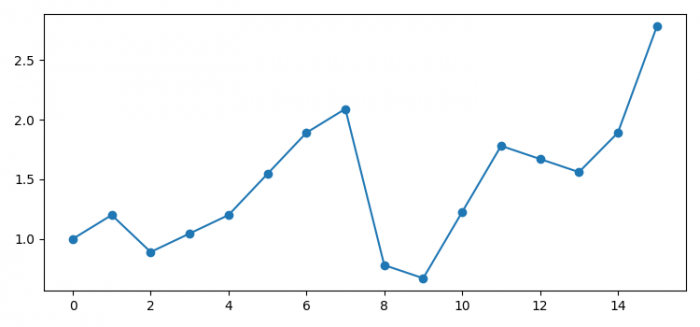
df.interpolate('index').plot(marker='o')

# Display the plot
plt.show()
输出
它将产生以下输出 –

 极客教程
极客教程