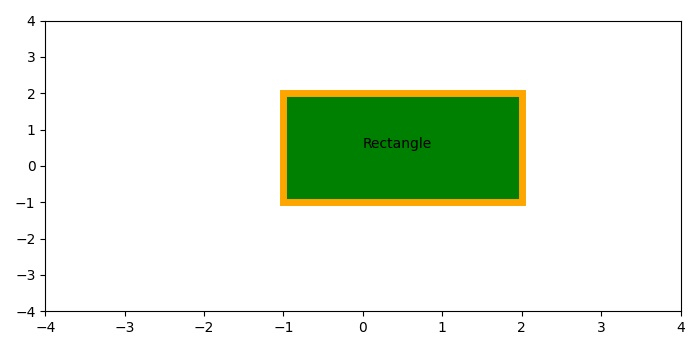
用 Matplotlib 绘制一个带有 edgecolor 的矩形
要为 matplotlib 的矩形设置边框颜色,可以按照以下步骤进行 –
- 使用 figure() 方法创建一个新的图形或激活现有图形。
-
在当前轴上添加 subplot 方法。
-
使用 Rectangle() 类创建带有 edgecolor 和边框宽度 linewidth 的矩形实例。
-
在图形上添加一个矩形路径。
-
要将文本放置在矩形内,可以使用 text() 方法。
-
使用 xlim() 和 ylim() 方法缩放 x 和 y 轴。
-
使用 show() 方法显示图形。
示例
import matplotlib
from matplotlib import pyplot as plt, patches
plt.rcParams["figure.figsize"] = [7.00, 3.50]
plt.rcParams["figure.autolayout"] = True
fig = plt.figure()
ax = fig.add_subplot(111)
rect = matplotlib.patches.Rectangle((-1, -1), 3, 3, edgecolor='orange', facecolor="green", linewidth=5)
ax.add_patch(rect)
plt.text(0, 0.5, "Rectangle")
plt.xlim([-4, 4])
plt.ylim([-4, 4])
plt.show()
输出

 极客教程
极客教程