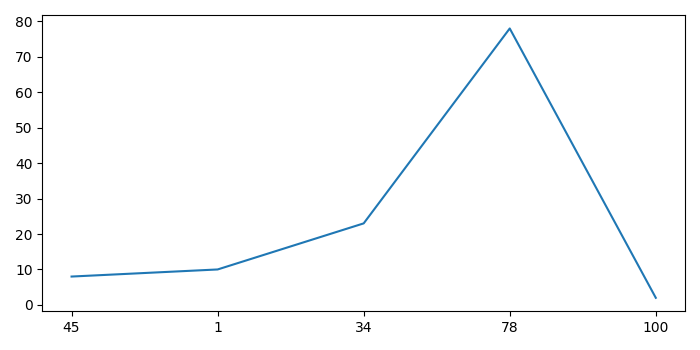
如何在Matplotlib Python中设置X轴值?
要在Python中的Matplotlib中设置X轴值,可以执行以下步骤 –
- 创建两个列表以存储X和Y数据点。
-
获取 xticks 范围值。
-
使用 plot() 方法绘制一条线,使用xtick范围值和Y数据点。
-
使用 xticks() 方法将 xticks 替换为X轴值。
-
使用 show() 方法显示图形。
示例
from matplotlib import pyplot as plt
plt.rcParams["figure.figsize"] = [7.00, 3.50]
plt.rcParams["figure.autolayout"] = True
x = [45, 1, 34, 78, 100]
y = [8, 10, 23, 78, 2]
default_x_ticks = range(len(x))
plt.plot(default_x_ticks, y)
plt.xticks(default_x_ticks, x)
plt.show()
输出

 极客教程
极客教程