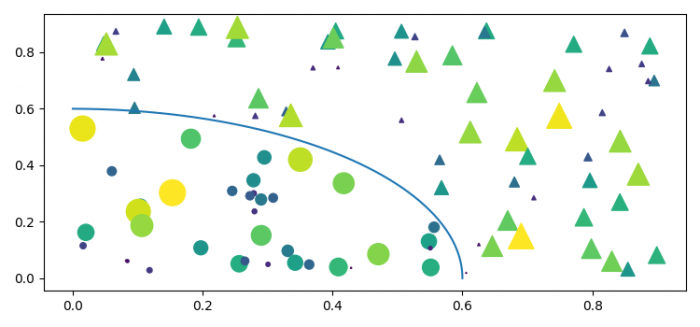
如何在Matplotlib中绘制散点掩模点并添加标记掩模区域的线?
要绘制散点掩模点并添加线以划分掩模区域,可以执行以下步骤。
步骤
- 设置图形大小和调整子图之间和周围的填充。
- 使用numpy创建 N, r0, x, y, area, c, r, area1和area2 数据点。
- 使用 scatter() 方法绘制x和y数据点。
- 使用 plot() 方法绘制曲线以标记掩模区域。
- 使用 show() 方法显示图形。
示例
import matplotlib.pyplot as plt
import numpy as np

plt.rcParams["figure.figsize"] = [7.50, 3.50]
plt.rcParams["figure.autolayout"] = True

N = 100
r0 = 0.6
x = 0.9 * np.random.rand(N)
y = 0.9 * np.random.rand(N)
area = (20 * np.random.rand(N))**2
c = np.sqrt(area)

r = np.sqrt(x ** 2 + y ** 2)
area1 = np.ma.masked_where(r < r0, area)
area2 = np.ma.masked_where(r >= r0, area)
plt.scatter(x, y, s=area1, marker='^', c=c)
plt.scatter(x, y, s=area2, marker='o', c=c)
theta = np.arange(0, np.pi / 2, 0.01)
plt.plot(r0 * np.cos(theta), r0 * np.sin(theta))

plt.show()
输出

 极客教程
极客教程