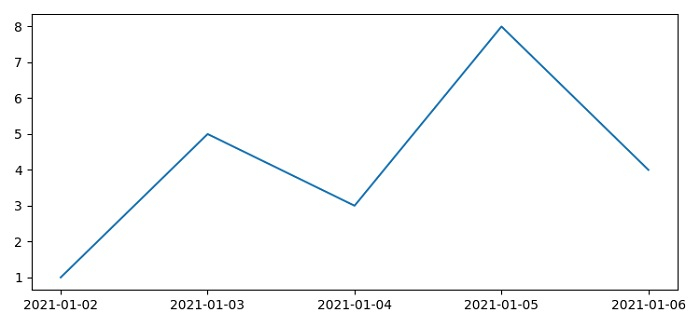
如何使用Matplotlib在X轴上绘制特定日期的数据?
使用matplotlib在X轴上绘制特定日期的数据,可以按照以下步骤进行 –
- 设置图形大小并调整子图之间和周围的间距。
-
制作日期列表并将它们转换为datetime格式,作为x轴的数据。
-
制作y轴数据点的列表。
-
设置主要刻度线的格式化程序。
-
设置主要刻度线的定位器。
-
使用 plot() 函数绘制x和y数据点。
-
使用 show() 函数显示图像。
示例
from datetime import datetime
from matplotlib import pyplot as plt, dates as mdates

plt.rcParams["figure.figsize"] = [7.50, 3.50]
plt.rcParams["figure.autolayout"] = True

dates = ["01/02/2021", "01/03/2021", "01/04/2021", "01/05/2021", "01/06/2021", ]

# 将日期列表转换为datetime格式
x = [datetime.strptime(d, "%m/%d/%Y").date() for d in dates]
y = [1, 5, 3, 8, 4]

ax = plt.gca()
ax.xaxis.set_major_formatter(mdates.DateFormatter("%Y-%m-%d"))
ax.xaxis.set_major_locator(mdates.DayLocator())
ax.plot(x, y)

plt.show()
输出

 极客教程
极客教程