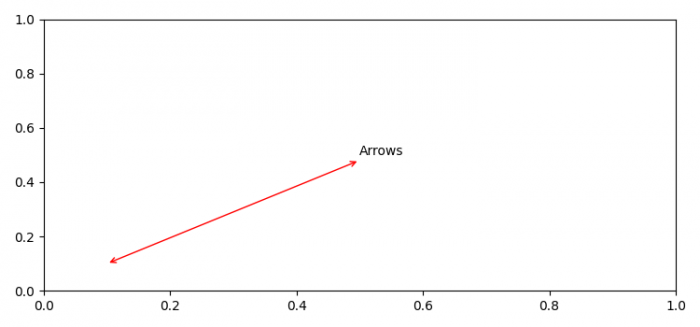
如何在Matplotlib中轴上制作简单的双头箭头?
在Matplotlib中制作简单双头箭头,可以按照以下步骤进行 –
- 设置图形大小并调整子图之间和周围的填充。
- 使用 annotate() 方法来注释点 xy 与 text=’Arrows’ 。在 arrowprops 字典中,使用 arrowstyle ” <->” ** 和 **color=’red’ 来开始和结束元组位置。
- 要显示该图形,使用 show() 方法。
示例
import matplotlib.pyplot as plt

plt.rcParams["figure.figsize"] = [7.50, 3.50]
plt.rcParams["figure.autolayout"] = True

plt.annotate('Arrows', xy=(0.1, .1), xytext=(0.5, 0.5),
            arrowprops=dict(arrowstyle='<->', color='red'))

plt.show()
输出

 极客教程
极客教程