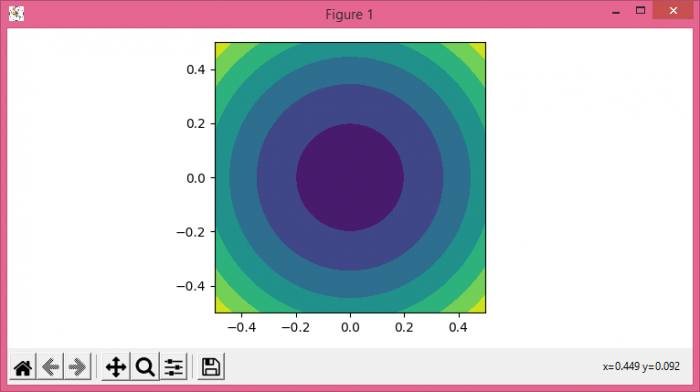
如何制作一个圆形的 matplotlib.pyplot.contourf?
要制作一个圆形的 matplotlib.pyplot.contourf,可以按照以下步骤进行操作:-
- 设置图形大小并调整子图之间和周围的填充。
-
使用Numpy创建 x,y,a,b 和 c 数据点。
-
创建一个figure和一组子图。
-
使用 contourf() 方法创建一个等高线图。
-
设置纵横比。
-
使用 show() 方法显示图形。
例子
import numpy as np
import matplotlib.pyplot as plt

plt.rcParams["figure.figsize"] = [7.50, 3.50]
plt.rcParams["figure.autolayout"] = True

x = np.linspace(-0.5, 0.5, 100)
y = np.linspace(-0.5, 0.5, 100)

a, b = np.meshgrid(x, y)
c = a ** 2 + b ** 2 - 0.2

figure, axes = plt.subplots()

axes.contourf(a, b, c)

axes.set_aspect(1)

plt.show()
输出

 极客教程
极客教程