如何为Matplotlib/Seaborn子图设置多图布局的间距?
为了调整 matplotlib/seaborn 的子图布局间距,我们可以执行以下步骤:
步骤
- 设置图形大小并调整子图之间和周围的填充。
-
创建一个图形和一组子图。
-
调整子图布局参数。
-
为所有子图创建 Seaborn 的 boxplot。
-
使用 Show() 方法展示图形。
示例
import seaborn as sns
from matplotlib import pyplot as plt

plt.rcParams["figure.figsize"] = [7.00, 3.50]
plt.rcParams["figure.autolayout"] = True

fig, axes = plt.subplots(2, 2)

# 调整子图布局参数
fig.subplots_adjust(hspace=0.125, wspace=0.125)

# 为所有子图创建 Seaborn 的 boxplot
sns.boxplot(ax=axes[0, 0])
sns.boxplot(ax=axes[0, 1])
sns.boxplot(ax=axes[1, 0])
sns.boxplot(ax=axes[1, 1])

# 展示图形
plt.show()
输出
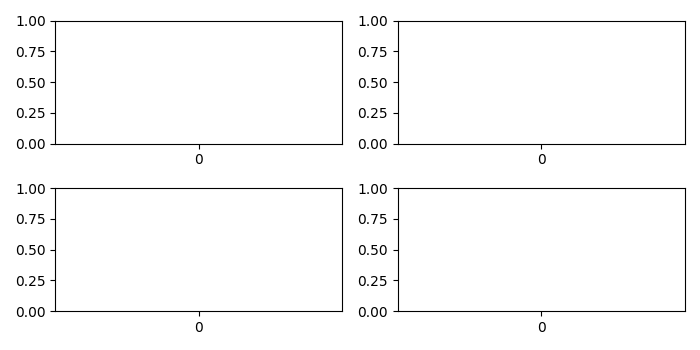
将会产生如下输出:

 极客教程
极客教程