如何在Matplotlib中调整图例标记和标签之间的间距?
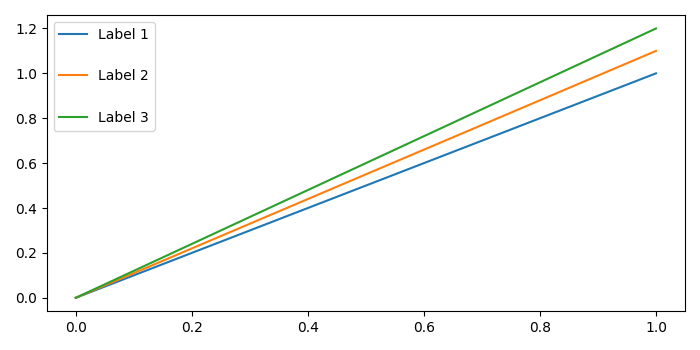
为了调整图例标记和标签之间的间距,我们可以在legend方法中使用labelspacing。
步骤
- 使用 label1 、 label2 和 label3 绘制线条。
-
初始化一个空间变量,以增加或减少图例标记和标签之间的间距。
-
在参数中使用 legend 方法和 labelspacing 。
-
使用 show() 方法显示图像。
示例
from matplotlib import pyplot as plt
plt.rcParams["figure.figsize"] = [7.00, 3.50]
plt.rcParams["figure.autolayout"] = True
plt.plot([0, 1], [0, 1.0], label='Label 1')
plt.plot([0, 1], [0, 1.1], label='Label 2')
plt.plot([0, 1], [0, 1.2], label='Label 3')
space = 2
plt.legend(labelspacing=space)
plt.show()
输出

 极客教程
极客教程