如何在使用Pandas’ plot创建的图中添加共享的x标签和y标签? (Matplotlib)
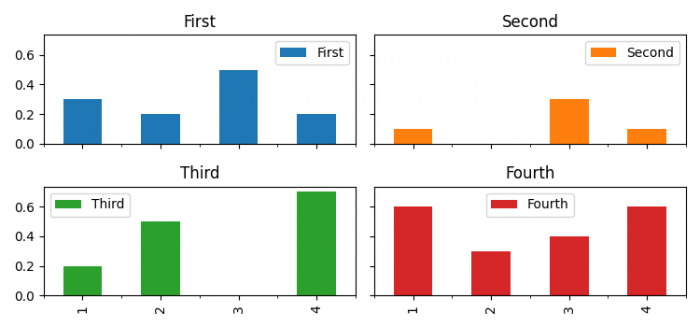
为了添加共享的x标签和y标签,我们可以使用带有 kind=”bar”,sharex=True 和 sharey=True 的 plot() 方法。
步骤
- 设置图形大小并调整子图之间和周围的填充。
- 创建一个二维的、大小可变的、可能是异构的表格数据。
- 使用 kind=”bar”,sharex=True 和 sharey=True 绘制数据框。
- 使用 show() 方法显示图形。
示例
import pandas as pd
import matplotlib.pyplot as plt

plt.rcParams["figure.figsize"] = [7.50, 3.50]
plt.rcParams["figure.autolayout"] = True

df = pd.DataFrame(
   {'First': [0.3, 0.2, 0.5, 0.2], 'Second': [0.1, 0.0, 0.3, 0.1],
   'Third': [0.2, 0.5, 0.0, 0.7], 'Fourth': [0.6, 0.3, 0.4, 0.6]},
   index=list('1234'))

axes = df.plot(kind="bar", subplots=True, layout=(2, 2),
               sharey=True, sharex=True)

plt.show()
输出

 极客教程
极客教程