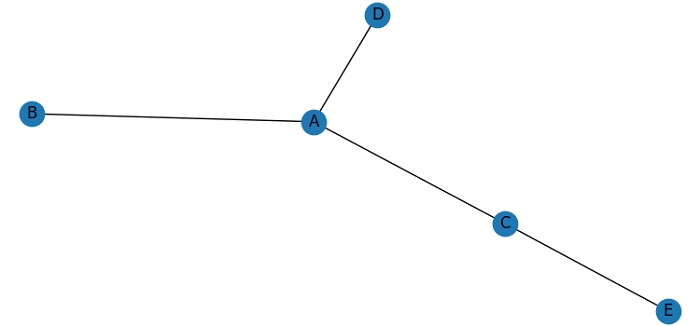
使用networkX和Matplotlib绘制网络图
要使用networkx和matplotlib绘制网络图,请使用plt. show() 。
- 设置图像大小并调整子图之间和周围的填充。
-
使用键 from 和 to 创建一个dataframe的对象。
-
获取包含 edgelist 的图表。
-
使用 draw() 方法以一些节点属性绘制图表(步骤3)。
-
要显示图像,请使用 show() 方法。
例子
import pandas as pd
import networkx as nx
from matplotlib import pyplot as plt
plt.rcParams["figure.figsize"] = [7.50, 3.50]
plt.rcParams["figure.autolayout"] = True
df = pd.DataFrame({'from': ['A', 'B', 'C', 'A'], 'to': ['D', 'A', 'E', 'C']})
G = nx.from_pandas_edgelist(df, 'from', 'to')
nx.draw(G, with_labels=True, node_size=100, alpha=1, linewidths=10)
plt.show()
输出

 极客教程
极客教程