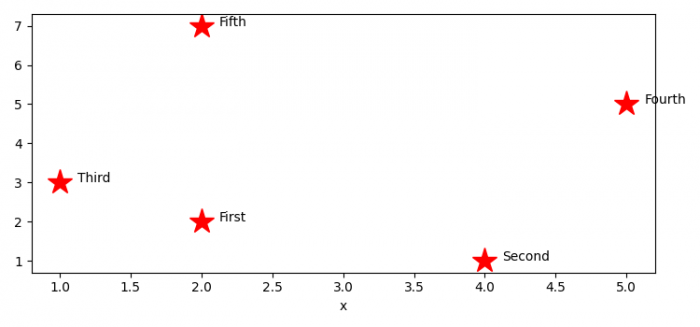
在Matplotlib图中标注Pandas Dataframe中的点
要在Matplotlib中标注Pandas数据框中的点,可以按照以下步骤进行-
- 设置图形大小并调整子图之间和周围的填充。
-
使用 x, y 和 textc 列创建二维大小可变的可能异构的表格数据。
-
使用 plot() 方法,绘制列 x 和 y 数据点。
-
通过指定特定的轴沿着它们进行连接,可以将Pandas对象沿着一个特定的轴连接在一起,沿着其他轴可以沿用。
-
对Pandas对象进行迭代。
-
使用 text() 方法为每个绘制的点放置文本。
-
使用 show() 方法显示图形。
实例
import pandas as pd
import matplotlib.pyplot as plt

plt.rcParams["figure.figsize"] = [7.50, 3.50]
plt.rcParams["figure.autolayout"] = True

df = pd.DataFrame(dict(x=[2, 4, 1, 5, 2], y=[2, 1, 3, 5, 7], text=['First', 'Second', 'Third', 'Fourth', 'Fifth']))

ax = df.set_index('x')['y'].plot(style='*', color='red', ms=20)

a = pd.concat({'x': df.x, 'y': df.y, 'text': df.text}, axis=1)

for i, point in a.iterrows():
   ax.text(point['x']+0.125, point['y'], str(point['text']))

plt.show()
输出

 极客教程
极客教程