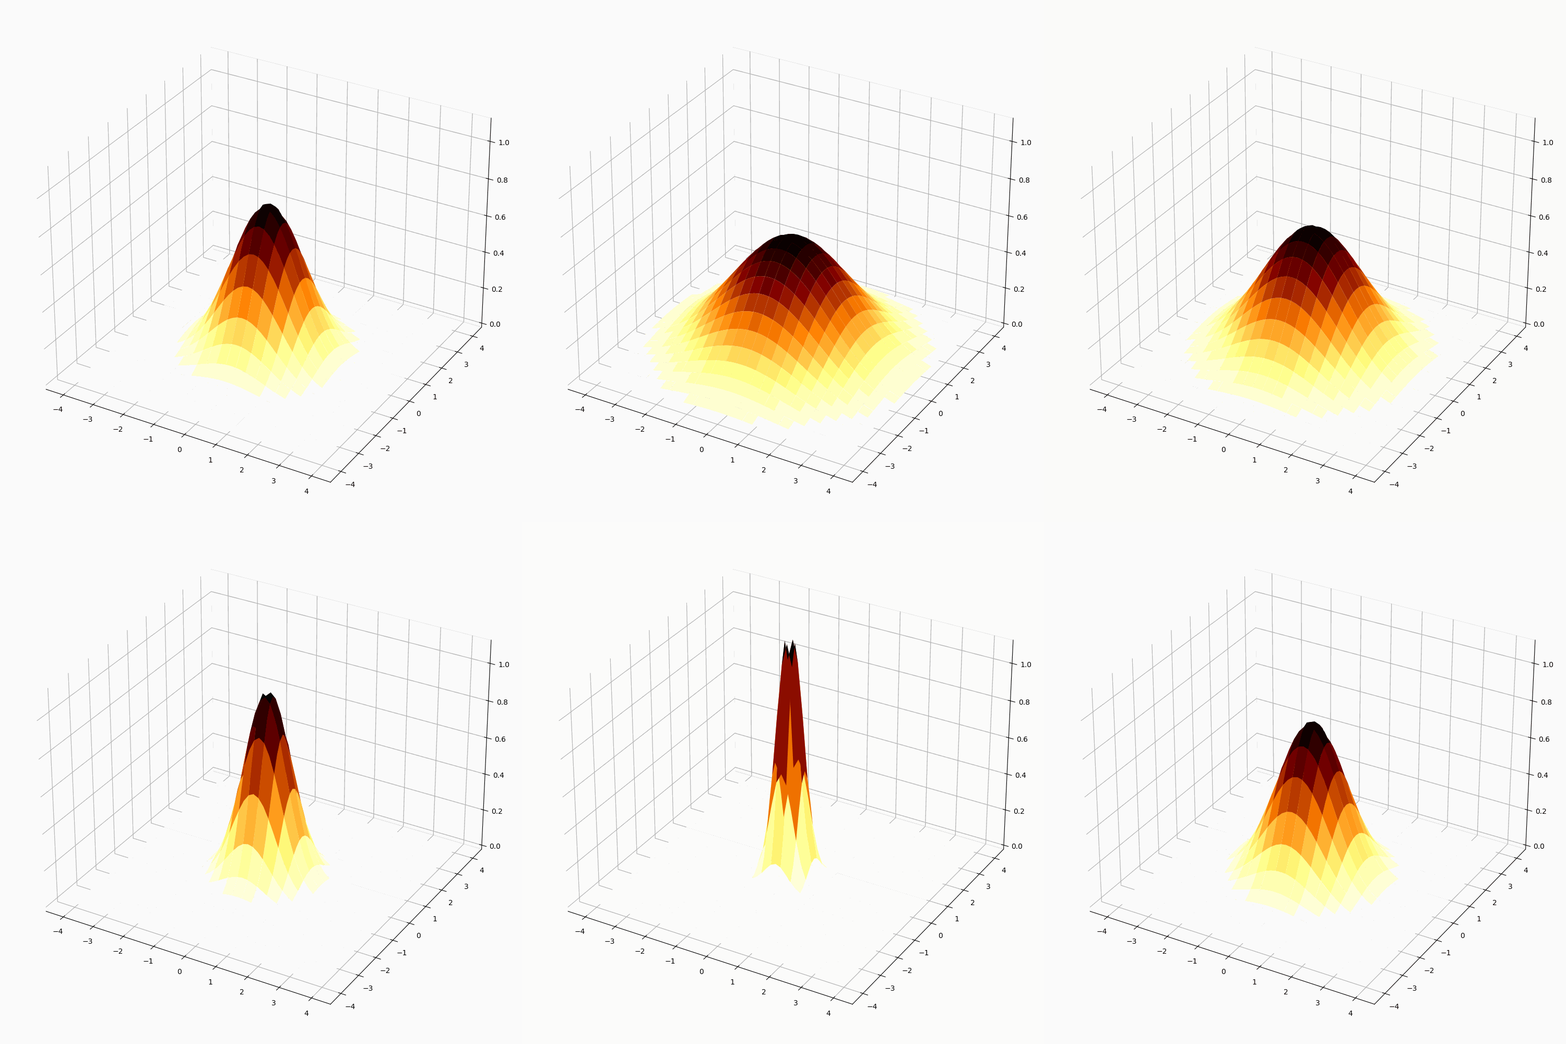
在Matplotlib中制作旋转的3D图表
为了制作旋转的3D图表,在matplotlib中,我们可以使用 Animation 类来重复调用函数。
步骤
- 初始化变量,包括网格数量、呼叫函数的每秒频率和帧数。
-
创建一个数组用于曲线的x、y和z值。
-
制作一个使用lambda函数的z数组函数。
-
为了将函数传递到动画类,制作一个用户定义的函数,以删除先前的绘图,并使用x、y和z数组绘制表面图。
-
创建一个新的图形或激活现有的图形。
-
使用subplots()方法添加一个子图布置。
-
使用 set_zlim() 方法设置Z轴限制。
-
调用 animation 类以动画显示表面图。
-
使用 show() 方法来显示动画图。
示例
import numpy as np
import matplotlib.pyplot as plt
import matplotlib.animation as animation

plt.rcParams["figure.figsize"] = [7.00, 3.50]
plt.rcParams["figure.autolayout"] = True
N = 50
fps = 250
frn = 75

x = np.linspace(-4, 4, N + 1)
x, y = np.meshgrid(x, x)
zarray = np.zeros((N + 1, N + 1, frn))

f = lambda x, y, sig: 1 / np.sqrt(sig) * np.exp(-(x ** 2 + y ** 2) / sig ** 2)

for i in range(frn):
   zarray[:, :, i] = f(x, y, 1.5 + np.sin(i * 2 * np.pi / frn))

def change_plot(frame_number, zarray, plot):
   plot[0].remove()
   plot[0] = ax.plot_surface(x, y, zarray[:, :, frame_number], cmap="afmhot_r")

fig = plt.figure()
ax = fig.add_subplot(111, projection='3d')

plot = [ax.plot_surface(x, y, zarray[:, :, 0], color='0.75', rstride=1,
cstride=1)]
ax.set_zlim(0, 1.1)
ani = animation.FuncAnimation(fig, change_plot, frn, fargs=(zarray, plot),
interval=1000 / fps)
ani.save('526.gif')

plt.show()
输出

 极客教程
极客教程