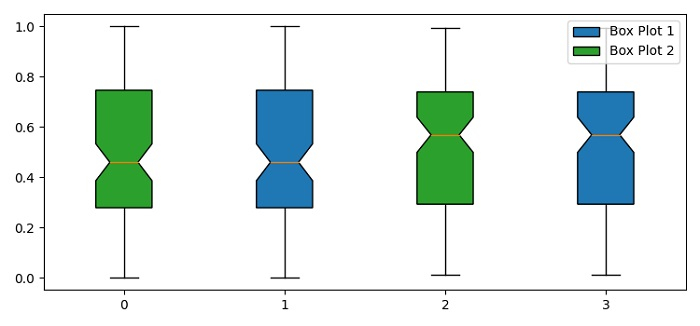
在同一轴上添加Matplotlib盒图的图例
要在同一轴上多个图中添加Matplotlib盒图的图例,可以采取以下步骤−
- 设置图的大小并调整子图之间和周围的填充。
-
使用numpy创建随机数据 a 和 b 。
-
创建新图形或使用 figure() 方法激活现有图形。
-
将坐标轴添加到当前图形作为子图布局。
-
使用不同的面板颜色和 boxplot() 方法制作箱式图和须形图。
-
使用 legend() 方法将图例放置在两个箱式图 bp1 和 bp2 以及排序后的标签的图例元素上。
-
使用 show() 方法显示图形。
示例
import matplotlib.pyplot as plt
import numpy as np

plt.rcParams["figure.figsize"] = [7.50, 3.50]
plt.rcParams["figure.autolayout"] = True

a = np.random.rand(100, 2)
b = np.random.rand(100, 2)

fig = plt.figure()
ax = fig.add_subplot(111)

bp1 = ax.boxplot(a, positions=[1, 3], notch=True, widths=0.35, patch_artist=True, boxprops=dict(facecolor="C0"))
bp2 = ax.boxplot(a, positions=[0, 2], notch=True, widths=0.35, patch_artist=True, boxprops=dict(facecolor="C2"))
ax.legend([bp1["boxes"][0], bp2["boxes"][0]], ["Box Plot 1", "Box Plot 2"], loc='upper right')

plt.show()
输出

 极客教程
极客教程