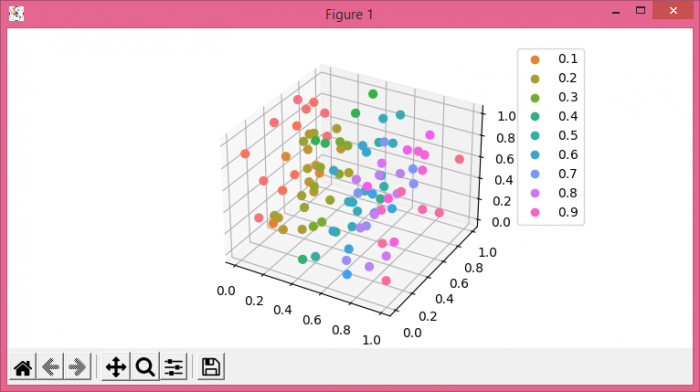
在Python Matplotlib中使用色调色标和图例绘制3D散点图
要在Python中使用色调色标和图例绘制3D散点图,可以按照以下步骤进行操作:
- 设置图形大小并调整子图之间和周围的填充。
- 使用numpy创建 x 、 y 和 z 数据点。
- 创建一个新图形或激活一个现有图形,使用 figure() 方法。
- 获取当前轴,如果需要创建一个轴。
- 获取色调色标,定义一个调色板。
- 使用 scatter() 方法绘制 x 、 y 和 z 数据点。
- 在绘图中放置一个图例。
- 使用 show() 方法显示图形。
示例
import numpy as np
import seaborn as sns
from matplotlib import pyplot as plt
from matplotlib.colors import ListedColormap

plt.rcParams["figure.figsize"] = [7.50, 3.50]
plt.rcParams["figure.autolayout"] = True

x = np.random.rand(100)
y = np.random.rand(100)
z = np.random.rand(100)

fig = plt.figure()
ax = fig.gca(projection='3d')
cmap = ListedColormap(sns.color_palette("husl", 256).as_hex())
sc = ax.scatter(x, y, z, s=40, c=x, marker='o', cmap=cmap, alpha=1)
plt.legend(*sc.legend_elements(), bbox_to_anchor=(1.05, 1), loc=2)

plt.show()
输出

 极客教程
极客教程