Matplotlib.axis.axis.grid()
matplotlib库的Axis模块中的Axis.grid()函数用于配置网格线。
语法:Axis.grid(self, b=None,which= ‘ major ‘, **kwargs)
参数:该方法接受以下参数。
- b:可选参数,是否显示网格线。
- 该参数也是一个可选参数,它是应用更改的网格线。
返回值:该方法不返回任何值。
下面的例子说明了matplotlib.axis.axis.grid()函数在matplotlib.axis中:
示例1
# Implementation of matplotlib function
from matplotlib.axis import Axis
import matplotlib.pyplot as plt
import numpy as np

fig, ax = plt.subplots()
ax.plot([1, 2, 3])
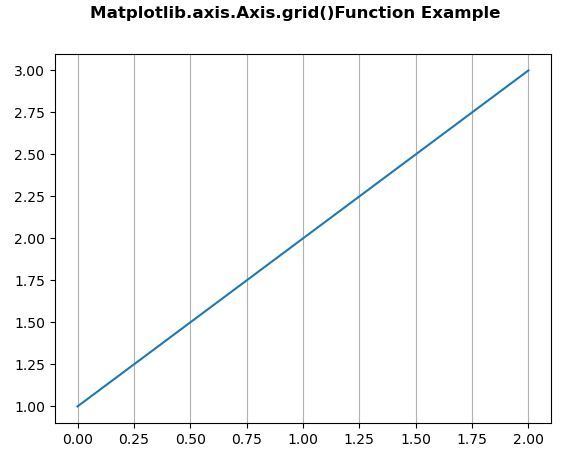
ax.xaxis.grid()

fig.suptitle("Matplotlib.axis.Axis.grid()\
Function Example", fontsize = 12, fontweight ='bold')

plt.show()
输出:

示例2
# Implementation of matplotlib function
from matplotlib.axis import Axis
import numpy as np
import matplotlib.pyplot as plt

x = np.arange(-5, 5, 0.01)
y1 = -3 * x*x + 10 * x + 10
y2 = 3 * x*x + x

fig, [ax, ax1] = plt.subplots(2, 1,
                              sharex = True)

ax.plot(x, y1, x, y2, color ='black')
ax.fill_between(x, y1, y2, where = y2 >y1,
                facecolor ='green',
                alpha = 0.8)

ax.fill_between(x, y1, y2, where = y2 <= y1,
                facecolor ='black',
                alpha = 0.8)

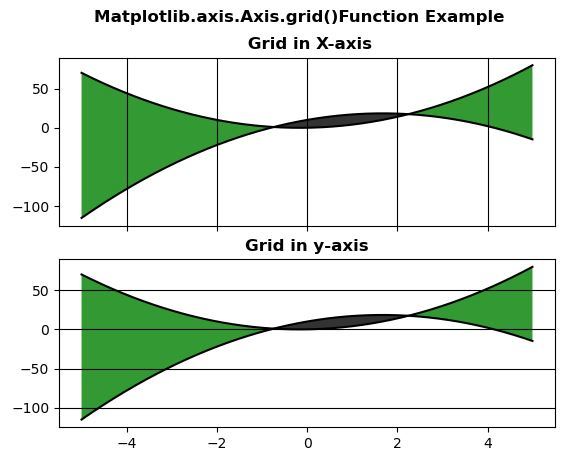
ax.xaxis.grid(True, color ="black")
ax.set_title('\n Grid in X-axis',
             fontsize = 12, fontweight ='bold')

ax1.plot(x, y1, x, y2, color ='black')
ax1.fill_between(x, y1, y2, where = y2 >y1,
                 facecolor ='green',
                 alpha = 0.8)

ax1.fill_between(x, y1, y2, where = y2 <= y1,
                 facecolor ='black',
                 alpha = 0.8)

ax1.yaxis.grid(True, color ="black")
ax1.set_title('Grid in y-axis',
             fontsize = 12, fontweight ='bold')

fig.suptitle("Matplotlib.axis.Axis.grid()\
Function Example", fontsize = 12, fontweight ='bold')

plt.show()
输出:

 极客教程
极客教程