Matplotlib.axis.axis.get_pickradius()
matplotlib库的Axis模块中的Axis.get_pickradius()函数用于获取选择器使用的轴的深度
语法:Axis.get_pickradius(self)
参数:该方法不接受任何参数。
返回值:该方法返回拾取器使用的轴的深度。
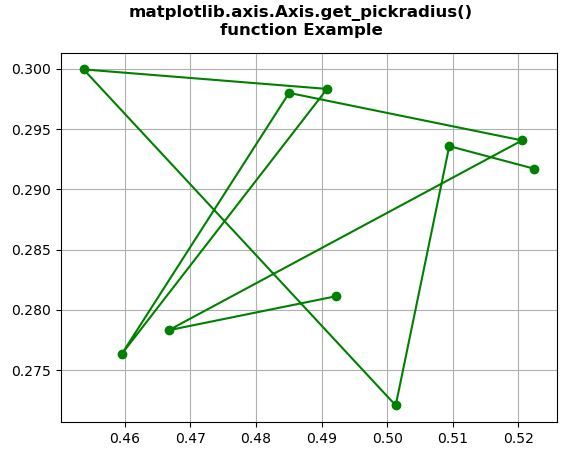
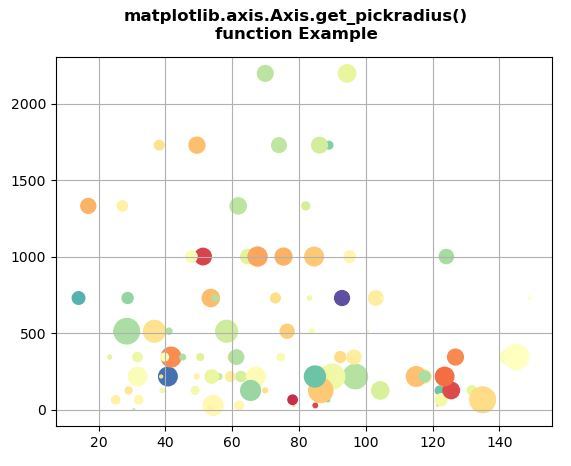
下面的例子演示了matplotlib.axis.axis.get_pickradius()函数在matplotlib.axis中的作用:
示例1
# Implementation of matplotlib function
from matplotlib.axis import Axis
import numpy as np
import matplotlib.pyplot as plt

X = np.random.rand(10, 200)
xs = np.mean(X, axis = 1)
ys = np.std(X, axis = 1)

fig = plt.figure()
ax = fig.add_subplot(111)
line, = ax.plot(xs, ys, 'go-')

ax.grid()

print("Value return by get_pickradius() :",
      ax.yaxis.get_pickradius())

fig.suptitle("""matplotlib.axis.Axis.get_pickradius()
function Example\n""", fontweight ="bold")

plt.show()
输出:

Value return by get_pickradius() : 15
示例2
# Implementation of matplotlib function
from matplotlib.axis import Axis
import numpy as np
import matplotlib.pyplot as plt

np.random.seed(19680801)

volume = np.random.rayleigh(27, size = 100)
amount = np.random.poisson(7, size = 100)
ranking = np.random.normal(size = 100)
price = np.random.uniform(1, 7, size = 100)

fig, ax = plt.subplots()

scatter = ax.scatter(volume * 2,
                     amount**3,
                     c = ranking,
                     s = price**3,
                     vmin = -3,
                     vmax = 3,
                     cmap ="Spectral")
ax.yaxis.set_pickradius(25)

ax.grid()

print("Value return by get_pickradius() :",
      ax.yaxis.get_pickradius())

fig.suptitle("""matplotlib.axis.Axis.get_pickradius()
function Example\n""", fontweight ="bold")

plt.show()
输出:

Value return by get_pickradius() : 25
 极客教程
极客教程