Matplotlib.axis.axis.get_majorticklocs()
matplotlib库的Axis模块中的Axis.get_majorticklocs()函数用于获取数据坐标中主要滴答位置的数组。
语法:Axis.get_majorticklocs(self)
参数:该方法不接受任何参数。
返回值:该方法返回数据坐标中的主要标记位置数组。
下面的例子演示了matplotlib.axis.axis.get_majorticklocs()函数在matplotlib.axis中的作用:
示例1
# Implementation of matplotlib function
from matplotlib.axis import Axis
from matplotlib.artist import Artist
from mpl_toolkits.mplot3d import axes3d
import matplotlib.pyplot as plt

fig, ax = plt.subplots()

def tellme(s):
    ax.set_title(s, fontsize = 16)
    fig.canvas.draw()
    renderer = fig.canvas.renderer
    Artist.draw(ax, renderer)

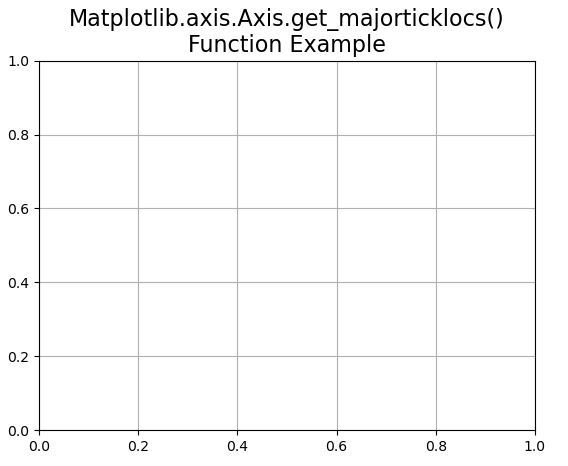
tellme("Matplotlib.axis.Axis.get_majorticklocs()\n\
Function Example")
ax.grid()

print("Value of get_majorticklocs() :")
for i in ax.xaxis.get_majorticklocs():
    print(i)

plt.show()
输出:

Value of get_majorticklocs() :
0.0
0.2
0.4
0.6000000000000001
0.8
1.0
示例2
# Implementation of matplotlib function
from matplotlib.axis import Axis
from matplotlib.artist import Artist
from mpl_toolkits.mplot3d import axes3d
import matplotlib.pyplot as plt


fig = plt.figure()
ax = fig.add_subplot(111, projection ='3d')

X, Y, Z = axes3d.get_test_data(0.1)
ax.plot_wireframe(X, Y, Z, rstride = 5,
                  cstride = 5)


ax.view_init(30, 50)
fig.canvas.draw()
renderer = fig.canvas.renderer
Artist.draw(ax, renderer)

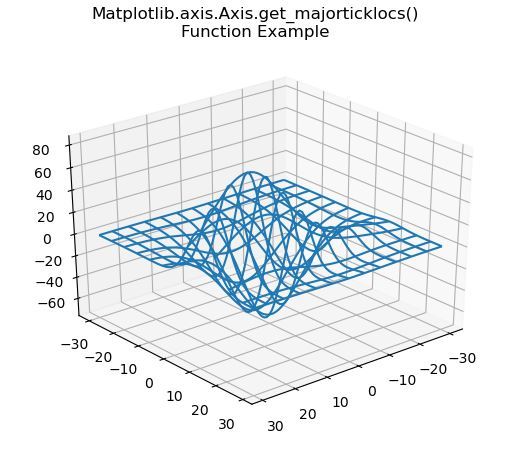
fig.suptitle('Matplotlib.axis.Axis.get_majorticklocs()\n\
Function Example')
ax.grid()

print("Value of get_majorticklocs() :")
for i in ax.xaxis.get_majorticklocs():
    print(i)

plt.show()
输出:

Value of get_majorticklocs() :
-40.0
-30.0
-20.0
-10.0
0.0
10.0
20.0
30.0
40.0
 极客教程
极客教程