Matplotlib中使用plt.subplots和figsize创建自定义大小的子图布局
Matplotlib是Python中最流行的数据可视化库之一,它提供了丰富的绘图功能和灵活的自定义选项。在使用Matplotlib进行数据可视化时,我们经常需要创建多个子图并调整图形的大小。本文将详细介绍如何使用plt.subplots函数和figsize参数来创建自定义大小的子图布局,帮助你更好地掌握这些重要的Matplotlib功能。
1. plt.subplots函数简介
plt.subplots是Matplotlib库中的一个重要函数,它允许我们在一个图形窗口中创建多个子图。这个函数返回一个包含图形对象(Figure)和轴对象(Axes)的元组,使我们能够方便地操作整个图形以及各个子图。
基本用法
让我们从一个简单的例子开始,创建一个包含2行2列子图的图形:
import matplotlib.pyplot as plt
import numpy as np

fig, axs = plt.subplots(2, 2)
fig.suptitle('How2matplotlib.com Example')

for i in range(2):
    for j in range(2):
        axs[i, j].plot(np.random.rand(10))

plt.tight_layout()
plt.show()
Output:
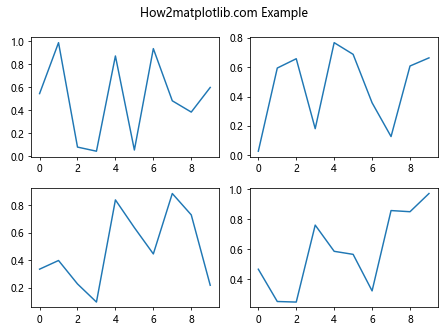
在这个例子中,我们使用plt.subplots(2, 2)创建了一个2×2的子图网格。fig是整个图形对象,axs是一个2×2的NumPy数组,包含了4个轴对象。我们遍历这些轴对象,在每个子图中绘制随机数据。
2. figsize参数详解
figsize参数用于设置整个图形的大小。它接受一个包含两个元素的元组,分别表示图形的宽度和高度,单位为英寸。
使用figsize调整图形大小
让我们创建一个更大的图形,并在其中放置3个子图:
import matplotlib.pyplot as plt
import numpy as np

fig, axs = plt.subplots(1, 3, figsize=(15, 5))
fig.suptitle('How2matplotlib.com: Custom Figure Size')

x = np.linspace(0, 10, 100)
for i, ax in enumerate(axs):
    ax.plot(x, np.sin(x + i * np.pi/2))
    ax.set_title(f'Subplot {i+1}')

plt.tight_layout()
plt.show()
Output:
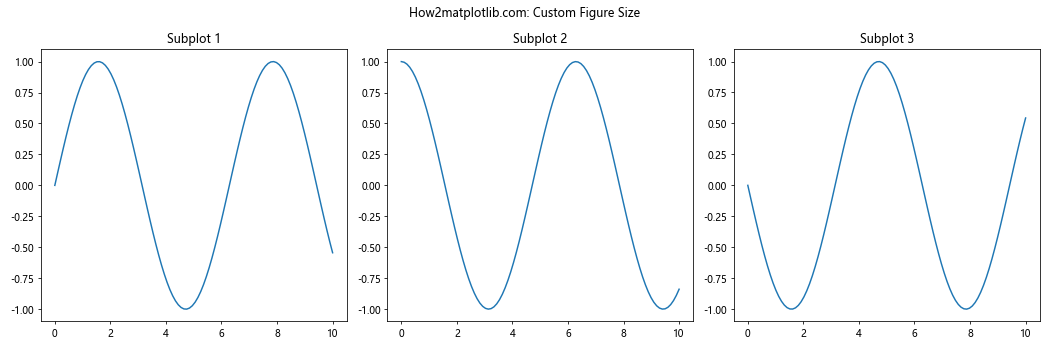
在这个例子中,我们使用figsize=(15, 5)创建了一个宽15英寸、高5英寸的图形。这个图形包含3个并排的子图,每个子图显示一个正弦函数。
3. 创建不同大小的子图
虽然plt.subplots默认创建大小相等的子图,但我们可以使用gridspec模块来创建不同大小的子图。
import matplotlib.pyplot as plt
import matplotlib.gridspec as gridspec
import numpy as np

fig = plt.figure(figsize=(12, 8))
fig.suptitle('How2matplotlib.com: Different Sized Subplots')

gs = gridspec.GridSpec(2, 2)
ax1 = fig.add_subplot(gs[0, :])
ax2 = fig.add_subplot(gs[1, 0])
ax3 = fig.add_subplot(gs[1, 1])

x = np.linspace(0, 10, 100)
ax1.plot(x, np.sin(x))
ax2.plot(x, np.cos(x))
ax3.plot(x, np.tan(x))

ax1.set_title('Sine Function')
ax2.set_title('Cosine Function')
ax3.set_title('Tangent Function')

plt.tight_layout()
plt.show()
Output:
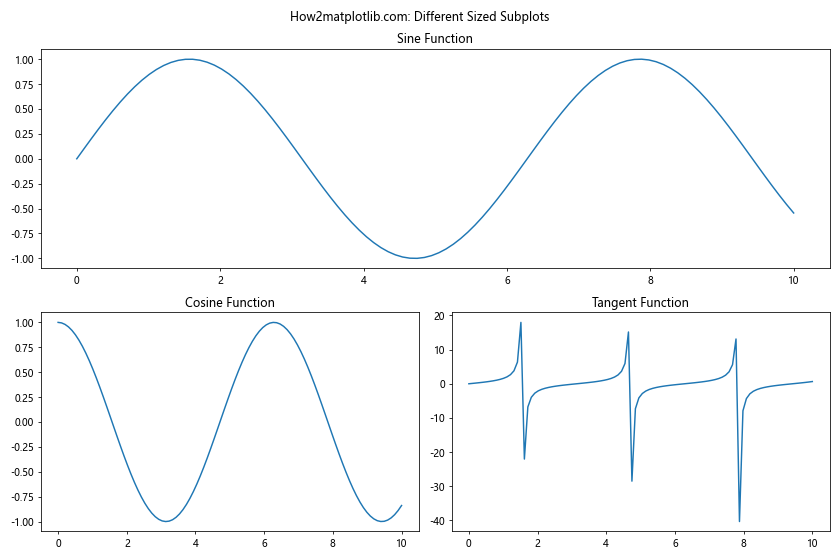
在这个例子中,我们使用gridspec创建了一个2×2的网格,但是将上面一行合并成一个大的子图,下面一行保持为两个小的子图。
4. 调整子图之间的间距
plt.subplots函数提供了hspace和wspace参数,用于调整子图之间的垂直和水平间距。
import matplotlib.pyplot as plt
import numpy as np

fig, axs = plt.subplots(2, 2, figsize=(10, 10))
fig.suptitle('How2matplotlib.com: Adjusting Subplot Spacing')

for i in range(2):
    for j in range(2):
        axs[i, j].plot(np.random.rand(10))
        axs[i, j].set_title(f'Subplot ({i+1}, {j+1})')

plt.subplots_adjust(hspace=0.5, wspace=0.5)
plt.show()
Output:
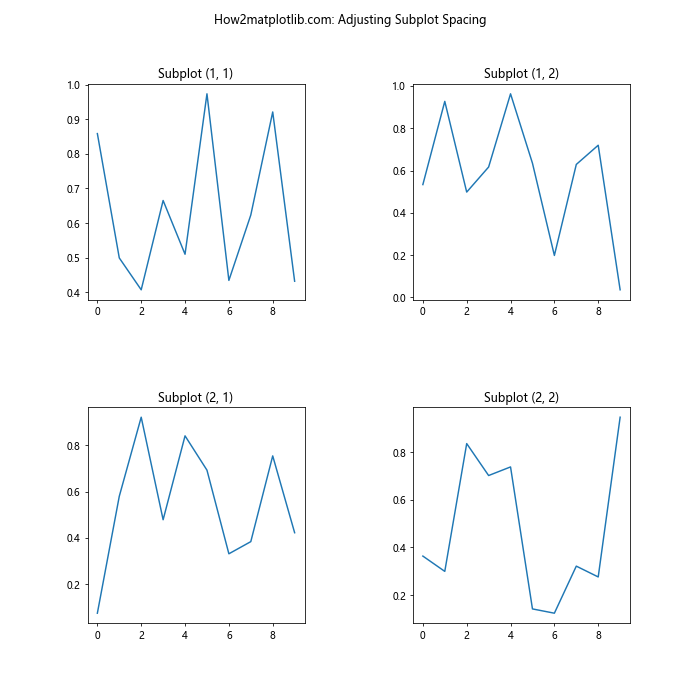
在这个例子中,我们使用plt.subplots_adjust(hspace=0.5, wspace=0.5)增加了子图之间的间距。hspace控制垂直间距,wspace控制水平间距。
5. 在子图中添加共享轴
plt.subplots函数还允许我们创建共享x轴或y轴的子图,这在比较多个相关数据集时非常有用。
import matplotlib.pyplot as plt
import numpy as np

fig, (ax1, ax2) = plt.subplots(2, 1, figsize=(8, 6), sharex=True)
fig.suptitle('How2matplotlib.com: Shared X-axis')

x = np.linspace(0, 10, 100)
ax1.plot(x, np.sin(x))
ax2.plot(x, np.cos(x))

ax1.set_title('Sine Function')
ax2.set_title('Cosine Function')
ax2.set_xlabel('X-axis')

plt.tight_layout()
plt.show()
Output:
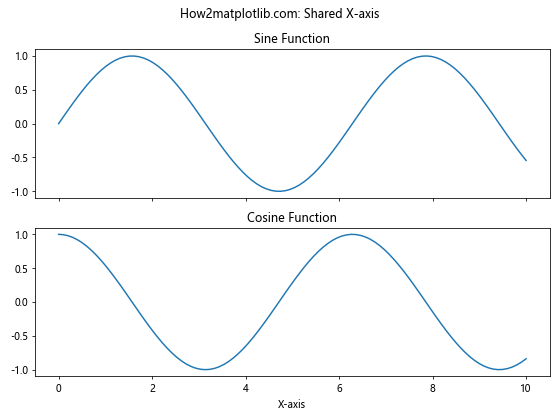
在这个例子中,我们使用sharex=True参数创建了两个共享x轴的子图。这样,当我们在一个子图中缩放或平移x轴时,另一个子图的x轴也会相应地更新。
6. 创建具有不同比例的子图
有时我们可能需要在同一个图形中创建具有不同比例的子图。这可以通过设置每个子图的aspect参数来实现。
import matplotlib.pyplot as plt
import numpy as np

fig, (ax1, ax2) = plt.subplots(1, 2, figsize=(12, 5))
fig.suptitle('How2matplotlib.com: Subplots with Different Aspects')

x = np.linspace(0, 10, 100)
y1 = np.sin(x)
y2 = np.cos(x)

ax1.plot(x, y1)
ax1.set_title('Aspect = auto')
ax1.set_aspect('auto')

ax2.plot(x, y2)
ax2.set_title('Aspect = equal')
ax2.set_aspect('equal')

plt.tight_layout()
plt.show()
Output:
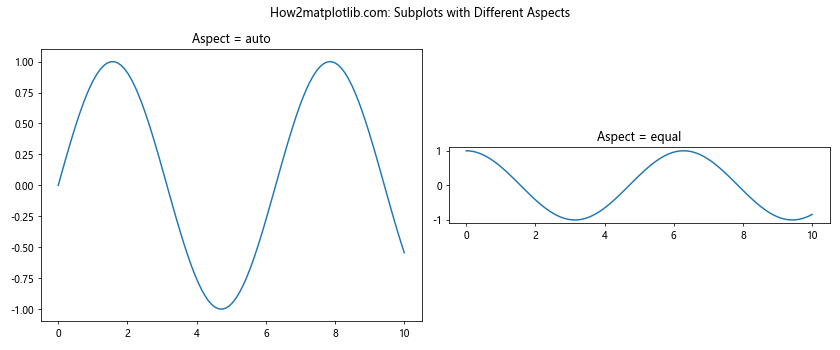
在这个例子中,左侧的子图使用默认的'auto'纵横比,而右侧的子图使用'equal'纵横比,这会使x轴和y轴的刻度间距相等。
7. 在子图中添加颜色条
当我们使用plt.subplots创建多个子图时,有时可能需要为每个子图添加一个颜色条(colorbar)。以下是一个示例:
import matplotlib.pyplot as plt
import numpy as np

fig, (ax1, ax2) = plt.subplots(1, 2, figsize=(12, 5))
fig.suptitle('How2matplotlib.com: Subplots with Colorbars')

data1 = np.random.rand(10, 10)
data2 = np.random.rand(10, 10)

im1 = ax1.imshow(data1, cmap='viridis')
im2 = ax2.imshow(data2, cmap='plasma')

fig.colorbar(im1, ax=ax1, label='Values')
fig.colorbar(im2, ax=ax2, label='Values')

ax1.set_title('Viridis Colormap')
ax2.set_title('Plasma Colormap')

plt.tight_layout()
plt.show()
Output:
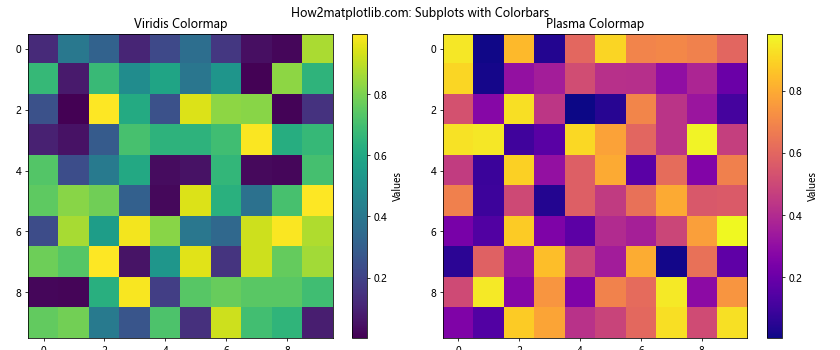
在这个例子中,我们创建了两个子图,每个子图显示一个随机数据的热图,并为每个子图添加了一个颜色条。
8. 在子图中添加文本注释
有时我们可能需要在子图中添加文本注释来解释数据或突出显示某些特征。以下是一个示例:
import matplotlib.pyplot as plt
import numpy as np

fig, (ax1, ax2) = plt.subplots(1, 2, figsize=(12, 5))
fig.suptitle('How2matplotlib.com: Subplots with Text Annotations')

x = np.linspace(0, 10, 100)
y1 = np.sin(x)
y2 = np.cos(x)

ax1.plot(x, y1)
ax1.set_title('Sine Function')
ax1.annotate('Peak', xy=(np.pi/2, 1), xytext=(np.pi/2, 0.5),
             arrowprops=dict(facecolor='black', shrink=0.05))

ax2.plot(x, y2)
ax2.set_title('Cosine Function')
ax2.text(5, 0, 'Zero Crossing', fontsize=12, ha='center')

plt.tight_layout()
plt.show()
Output:
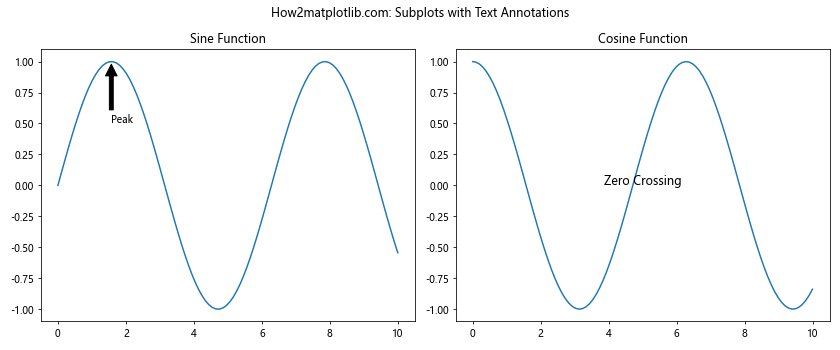
在这个例子中,我们在正弦函数图中添加了一个带箭头的注释来指出峰值,在余弦函数图中添加了一个文本注释来标记零点交叉。
9. 在子图中添加图例
当我们在一个子图中绘制多条线时,添加图例可以帮助区分不同的数据系列。以下是一个示例:
import matplotlib.pyplot as plt
import numpy as np

fig, (ax1, ax2) = plt.subplots(2, 1, figsize=(8, 8))
fig.suptitle('How2matplotlib.com: Subplots with Legends')

x = np.linspace(0, 10, 100)

ax1.plot(x, np.sin(x), label='sin(x)')
ax1.plot(x, np.cos(x), label='cos(x)')
ax1.set_title('Trigonometric Functions')
ax1.legend()

ax2.plot(x, x**2, label='x^2')
ax2.plot(x, np.sqrt(x), label='sqrt(x)')
ax2.set_title('Power Functions')
ax2.legend()

plt.tight_layout()
plt.show()
Output:
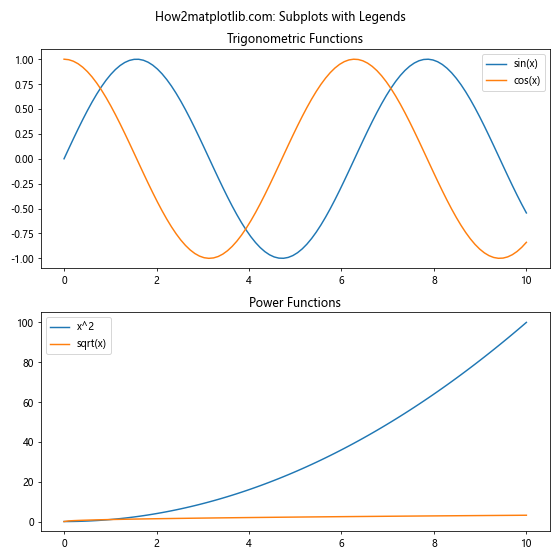
在这个例子中,我们在每个子图中绘制了两条线,并使用legend()方法添加了图例。
10. 在子图中使用不同的绘图类型
plt.subplots的一个强大特性是它允许我们在不同的子图中使用不同类型的绘图。以下是一个结合了线图、散点图和条形图的示例:
import matplotlib.pyplot as plt
import numpy as np

fig, (ax1, ax2, ax3) = plt.subplots(1, 3, figsize=(15, 5))
fig.suptitle('How2matplotlib.com: Different Plot Types')

x = np.linspace(0, 10, 100)
y = np.sin(x)

ax1.plot(x, y)
ax1.set_title('Line Plot')

ax2.scatter(x[::10], y[::10])
ax2.set_title('Scatter Plot')

ax3.bar(x[::10], y[::10])
ax3.set_title('Bar Plot')

plt.tight_layout()
plt.show()
Output:
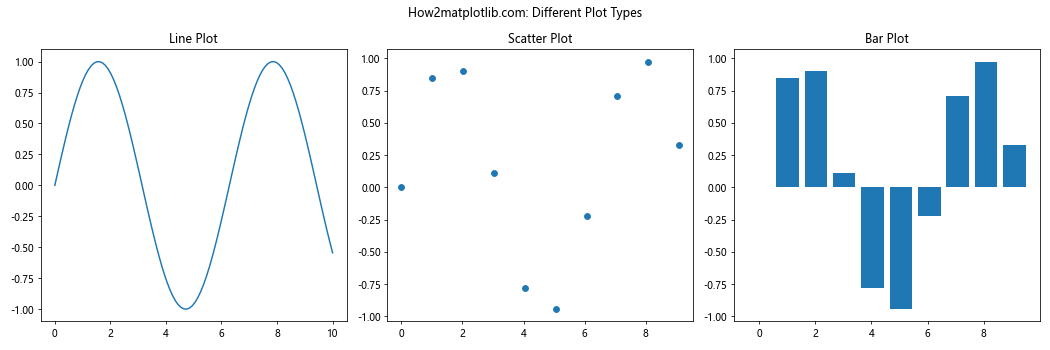
在这个例子中,我们创建了三个子图,分别使用线图、散点图和条形图来可视化相同的数据。
11. 在子图中添加网格线
网格线可以帮助读者更准确地解读图表中的数据。以下是一个在子图中添加网格线的示例:
import matplotlib.pyplot as plt
import numpy as np

fig, (ax1, ax2) = plt.subplots(1, 2, figsize=(12, 5))
fig.suptitle('How2matplotlib.com: Subplots with Grid Lines')

x = np.linspace(0, 10, 100)

ax1.plot(x, np.sin(x))
ax1.set_title('Major Grid Lines')
ax1.grid(True)

ax2.plot(x, np.cos(x))
ax2.set_title('Major and Minor Grid Lines')
ax2.grid(True, which='both', linestyle='--')
ax2.minorticks_on()

plt.tight_layout()
plt.show()
Output:
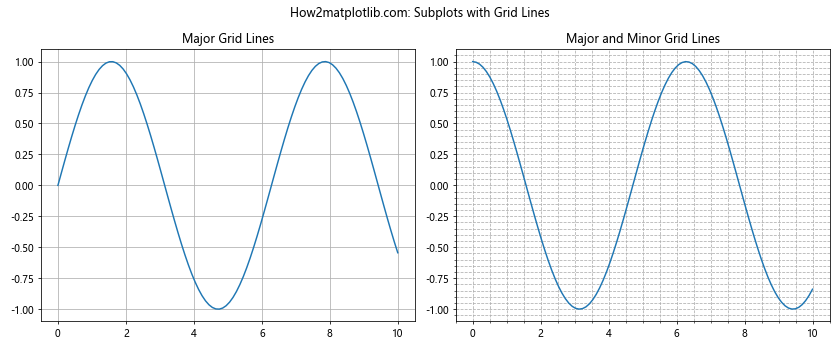
在这个例子中,左侧的子图只显示主要网格线,而右侧的子图同时显示主要和次要网格线。
12. 在子图中使用不同的坐标系
Matplotlib支持多种坐标系,我们可以在不同的子图中使用不同的坐标系。以下是一个结合了笛卡尔坐标系和极坐标系的示例:
import matplotlib.pyplot as plt
import numpy as np

fig, (ax1, ax2) = plt.subplots(1, 2, figsize=(12, 5), subplot_kw=dict(projection='polar'))
fig.suptitle('How2matplotlib.com: Different Coordinate Systems')

theta = np.linspace(0, 2*np.pi, 100)

ax1.plot(theta, np.sin(2*theta))
ax1.set_title('Polar Plot 1')

ax2.plot(theta, np.cos(3*theta))
ax2.set_title('Polar Plot 2')

plt.tight_layout()
plt.show()
Output:
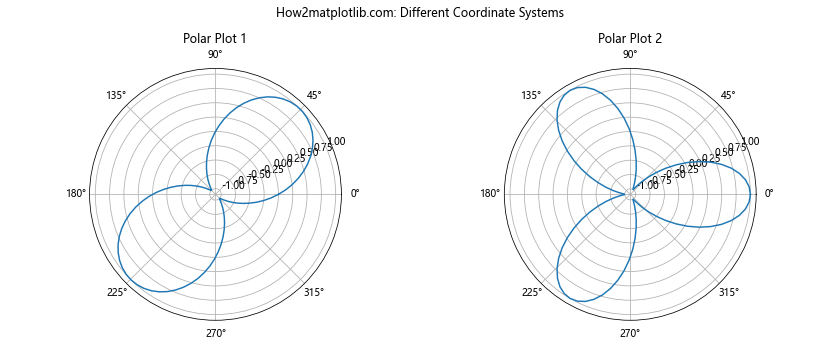
在这个例子中,我们创建了两个使用极坐标系的子图,并在其中绘制了不同的函数。
13. 在子图中添加次坐标轴
有时我们可能需要在一个子图中显示两个不同的y轴刻度,以比较具有不同单位或数量级的数据。以下是一个添加次坐标轴的示例:
import matplotlib.pyplot as plt
import numpy as np

fig, (ax1, ax2) = plt.subplots(1, 2, figsize=(12, 5))
fig.suptitle('How2matplotlib.com: Subplots with Secondary Y-axis')

x = np.linspace(0, 10, 100)
y1 = np.sin(x)
y2 = np.exp(x)

ax1.plot(x, y1, 'b-', label='sin(x)')
ax1.set_ylabel('sin(x)', color='b')
ax1.tick_params(axis='y', labelcolor='b')

ax1_twin = ax1.twinx()
ax1_twin.plot(x, y2, 'r-', label='exp(x)')
ax1_twin.set_ylabel('exp(x)', color='r')
ax1_twin.tick_params(axis='y', labelcolor='r')

ax1.set_title('Sin and Exp Functions')

y3 = x**2
y4 = x**3

ax2.plot(x, y3, 'g-', label='x^2')
ax2.set_ylabel('x^2', color='g')
ax2.tick_params(axis='y', labelcolor='g')

ax2_twin = ax2.twinx()
ax2_twin.plot(x, y4, 'm-', label='x^3')
ax2_twin.set_ylabel('x^3', color='m')
ax2_twin.tick_params(axis='y', labelcolor='m')

ax2.set_title('Quadratic and Cubic Functions')

plt.tight_layout()
plt.show()
Output:
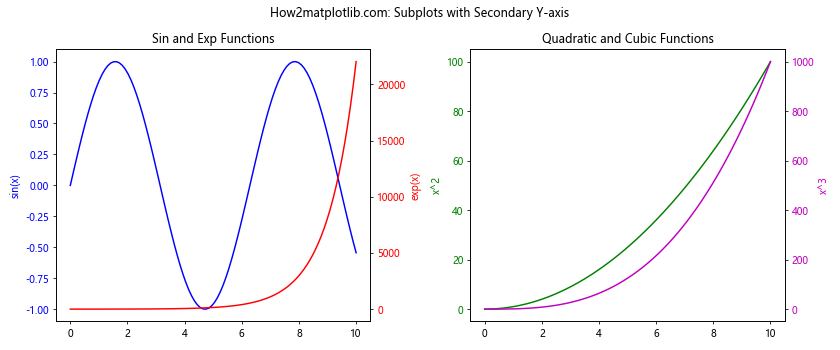
在这个例子中,我们创建了两个子图,每个子图都有一个主y轴和一个次y轴。这允许我们在同一个子图中比较具有不同数量级的函数。
14. 在子图中添加子图
有时,我们可能需要在一个子图内部再添加一个小的子图,以显示数据的某个特定部分或概览。以下是一个示例:
import matplotlib.pyplot as plt
import numpy as np

fig, ax = plt.subplots(figsize=(10, 6))
fig.suptitle('How2matplotlib.com: Subplot within Subplot')

x = np.linspace(0, 10, 1000)
y = np.sin(x) + 0.1 * np.random.randn(1000)

ax.plot(x, y)
ax.set_title('Main Plot: Noisy Sine Wave')

# 创建一个嵌入的子图
ax_inset = ax.inset_axes([0.6, 0.1, 0.3, 0.3])
ax_inset.plot(x, np.sin(x), 'r')
ax_inset.set_title('Inset: Clean Sine Wave')
ax_inset.set_xlim(0, 2*np.pi)
ax_inset.set_ylim(-1, 1)

plt.tight_layout()
plt.show()
Output:
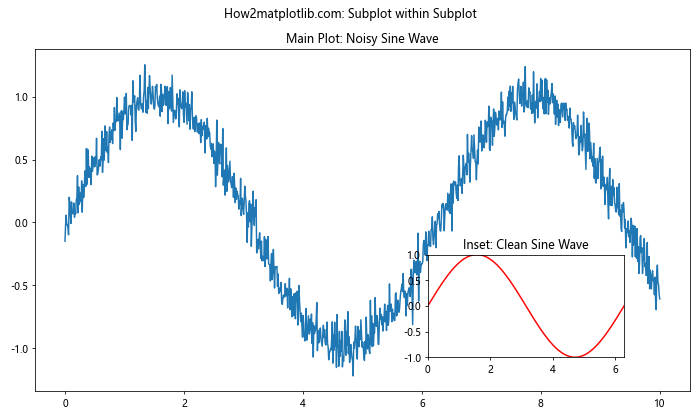
在这个例子中,我们在主图中绘制了一个带噪声的正弦波,然后在右下角添加了一个小的子图,显示了没有噪声的纯正弦波。
15. 使用不同的标记和线型
在使用plt.subplots创建多个子图时,我们可以为每个子图使用不同的标记和线型,以增加图表的可读性和美观性。以下是一个示例:
import matplotlib.pyplot as plt
import numpy as np

fig, axs = plt.subplots(2, 2, figsize=(12, 10))
fig.suptitle('How2matplotlib.com: Different Markers and Line Styles')

x = np.linspace(0, 10, 100)

axs[0, 0].plot(x, np.sin(x), 'r-o', markersize=4)
axs[0, 0].set_title('Sine with Circles')

axs[0, 1].plot(x, np.cos(x), 'g--s', markersize=4)
axs[0, 1].set_title('Cosine with Squares')

axs[1, 0].plot(x, np.tan(x), 'b:^', markersize=4)
axs[1, 0].set_title('Tangent with Triangles')

axs[1, 1].plot(x, x**2, 'm-.d', markersize=4)
axs[1, 1].set_title('Quadratic with Diamonds')

plt.tight_layout()
plt.show()
Output:
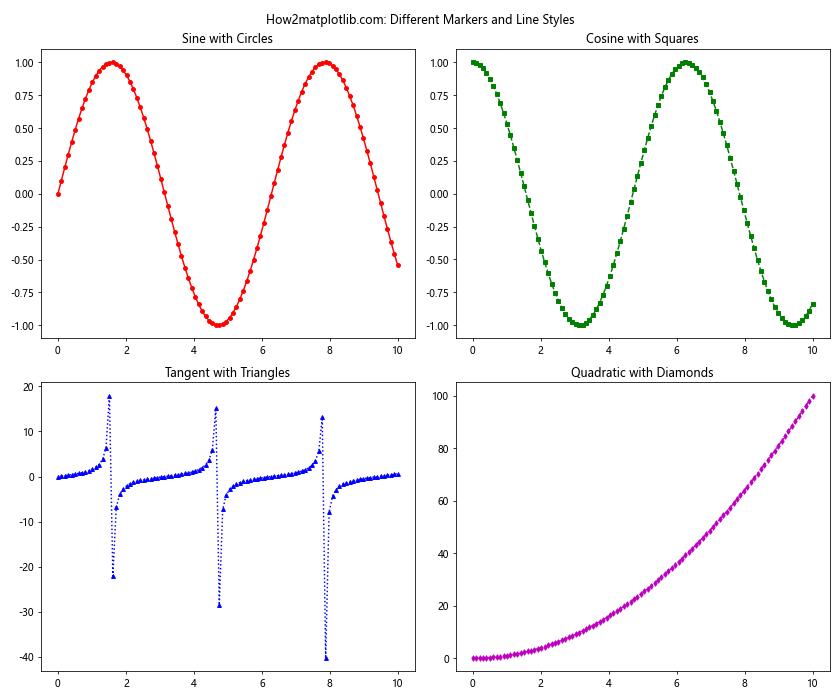
在这个例子中,我们创建了四个子图,每个子图都使用不同的颜色、线型和标记来绘制不同的函数。
16. 在子图中添加填充区域
有时我们可能想要强调图表中的某个区域,这可以通过添加填充区域来实现。以下是一个示例:
import matplotlib.pyplot as plt
import numpy as np

fig, (ax1, ax2) = plt.subplots(1, 2, figsize=(12, 5))
fig.suptitle('How2matplotlib.com: Subplots with Filled Areas')

x = np.linspace(0, 10, 100)
y1 = np.sin(x)
y2 = np.cos(x)

ax1.plot(x, y1, 'b-', label='sin(x)')
ax1.fill_between(x, y1, 0, where=(y1 > 0), alpha=0.3, color='b')
ax1.set_title('Sine Function with Positive Area Filled')
ax1.legend()

ax2.plot(x, y1, 'r-', label='sin(x)')
ax2.plot(x, y2, 'g-', label='cos(x)')
ax2.fill_between(x, y1, y2, where=(y1 > y2), alpha=0.3, color='r')
ax2.fill_between(x, y1, y2, where=(y1 <= y2), alpha=0.3, color='g')
ax2.set_title('Sine and Cosine with Area Between Filled')
ax2.legend()

plt.tight_layout()
plt.show()
Output:
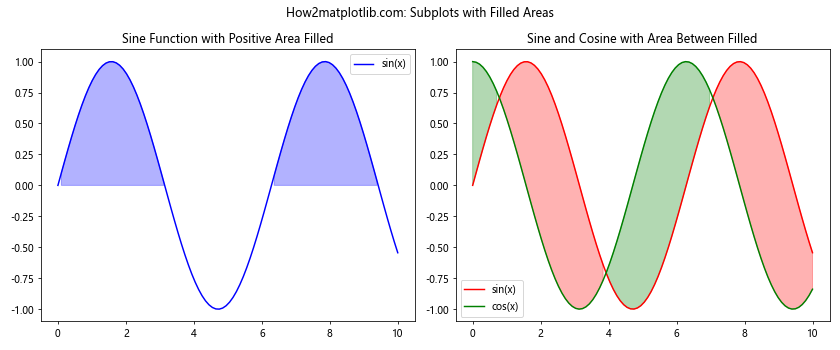
在这个例子中,左侧的子图填充了正弦函数的正值区域,右侧的子图填充了正弦和余弦函数之间的区域。
17. 在子图中使用对数刻度
对于跨越多个数量级的数据,使用对数刻度可能会更有效。以下是一个在子图中使用对数刻度的示例:
import matplotlib.pyplot as plt
import numpy as np

fig, (ax1, ax2) = plt.subplots(1, 2, figsize=(12, 5))
fig.suptitle('How2matplotlib.com: Subplots with Logarithmic Scales')

x = np.logspace(0, 5, 100)
y1 = x**2
y2 = x**3

ax1.plot(x, y1, label='x^2')
ax1.plot(x, y2, label='x^3')
ax1.set_xscale('log')
ax1.set_yscale('log')
ax1.set_title('Log-Log Plot')
ax1.legend()

ax2.semilogx(x, y1, label='x^2')
ax2.semilogx(x, y2, label='x^3')
ax2.set_title('Semilog Plot (Log X-axis)')
ax2.legend()

plt.tight_layout()
plt.show()
Output:
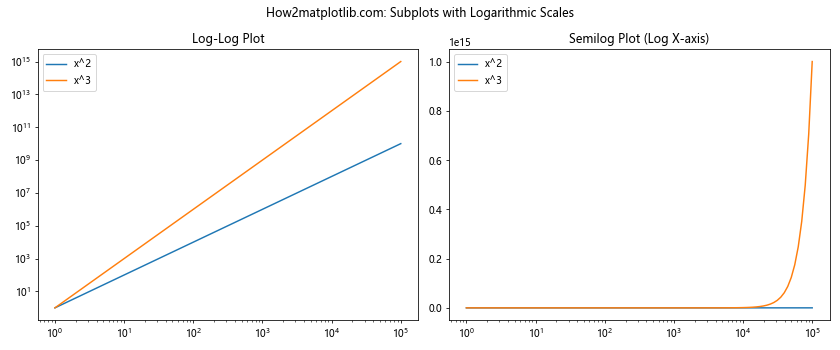
在这个例子中,左侧的子图使用了对数-对数刻度,而右侧的子图只在x轴使用了对数刻度。
结论
通过本文的详细介绍和丰富的示例,我们深入探讨了如何使用Matplotlib中的plt.subplots函数和figsize参数来创建自定义大小的子图布局。我们学习了如何创建不同数量和大小的子图,如何调整子图之间的间距,如何在子图中添加各种元素(如颜色条、文本注释、图例等),以及如何使用不同的绘图类型和坐标系。
这些技巧和方法可以帮助你创建更加丰富、信息量更大的数据可视化图表。通过灵活运用这些功能,你可以根据自己的需求定制出各种复杂的图表布局,更好地展示和分析你的数据。
记住,创建有效的数据可视化不仅仅是技术问题,还需要考虑数据的特性、目标受众以及你想要传达的信息。因此,在使用这些技术时,始终要考虑如何最清晰、最有效地呈现你的数据和发现。
最后,Matplotlib是一个非常强大和灵活的库,本文所涵盖的内容只是其功能的一小部分。随着你对Matplotlib的深入学习和使用,你会发现更多有趣和有用的功能,能够创建出更加精美和专业的数据可视化作品。
 极客教程
极客教程