Matplotlib 双色单线图:如何在一条线上绘制两种颜色
参考:matplotlib two colors one line
Matplotlib 是 Python 中最流行的数据可视化库之一,它提供了丰富的绘图功能。在数据可视化中,有时我们需要在同一条线上使用两种不同的颜色来突出显示某些特定的数据段或区间。本文将详细介绍如何使用 Matplotlib 在一条线上绘制两种颜色,包括多种实现方法、常见应用场景以及一些高级技巧。
1. 为什么需要双色单线图
在数据可视化中,双色单线图有多种用途:
- 突出显示数据的特定区间
- 区分数据的不同属性或状态
- 增强图表的视觉吸引力
- 提高数据的可读性和解释性
通过在同一条线上使用两种颜色,我们可以更有效地传达信息,使观众能够快速识别和理解数据中的重要特征。
2. 基本实现方法
2.1 使用 plot() 函数绘制两段线
最简单的方法是使用 Matplotlib 的 plot() 函数分别绘制两段不同颜色的线。
import matplotlib.pyplot as plt
import numpy as np

# 生成数据
x = np.linspace(0, 10, 100)
y = np.sin(x)

# 创建图形和坐标轴
fig, ax = plt.subplots()

# 绘制两段不同颜色的线
ax.plot(x[:50], y[:50], color='blue', label='First half')
ax.plot(x[49:], y[49:], color='red', label='Second half')

# 设置标题和标签
ax.set_title('Two Colors One Line - how2matplotlib.com')
ax.set_xlabel('X axis')
ax.set_ylabel('Y axis')

# 添加图例
ax.legend()

# 显示图形
plt.show()
Output:
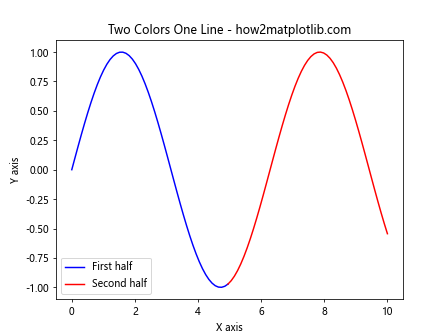
在这个例子中,我们首先生成了一组正弦波数据。然后,我们使用 plot() 函数分别绘制了数据的前半部分(蓝色)和后半部分(红色)。注意,我们在两段线的连接处使用了重叠的点(索引 49)以确保线条的连续性。
2.2 使用 LineCollection
另一种更灵活的方法是使用 Matplotlib 的 LineCollection 类。这种方法允许我们为线的每个段设置不同的颜色。
import matplotlib.pyplot as plt
import numpy as np
from matplotlib.collections import LineCollection

# 生成数据
x = np.linspace(0, 10, 100)
y = np.sin(x)

# 创建线段
points = np.array([x, y]).T.reshape(-1, 1, 2)
segments = np.concatenate([points[:-1], points[1:]], axis=1)

# 创建颜色数组
colors = np.where(x < 5, 'blue', 'red')

# 创建 LineCollection
lc = LineCollection(segments, colors=colors, linewidth=2)

# 创建图形和坐标轴
fig, ax = plt.subplots()

# 添加 LineCollection 到坐标轴
ax.add_collection(lc)

# 设置坐标轴范围
ax.set_xlim(x.min(), x.max())
ax.set_ylim(y.min(), y.max())

# 设置标题和标签
ax.set_title('Two Colors One Line using LineCollection - how2matplotlib.com')
ax.set_xlabel('X axis')
ax.set_ylabel('Y axis')

# 显示图形
plt.show()
Output:
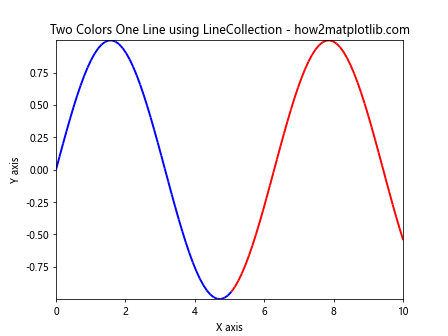
在这个例子中,我们首先创建了线段数组,然后根据 x 值的条件创建了颜色数组。使用这些信息,我们创建了一个 LineCollection 对象,并将其添加到坐标轴中。这种方法的优势在于它可以轻松地为线的每个段设置不同的颜色。
3. 高级技巧和应用
3.1 基于数据值的颜色变化
我们可以根据数据的实际值来动态改变线的颜色。这在可视化阈值或临界点时特别有用。
import matplotlib.pyplot as plt
import numpy as np
from matplotlib.collections import LineCollection

# 生成数据
x = np.linspace(0, 10, 100)
y = np.sin(x)

# 创建线段
points = np.array([x, y]).T.reshape(-1, 1, 2)
segments = np.concatenate([points[:-1], points[1:]], axis=1)

# 创建颜色数组
norm = plt.Normalize(-1, 1)
colors = plt.cm.coolwarm(norm(y))

# 创建 LineCollection
lc = LineCollection(segments, colors=colors, linewidth=2)

# 创建图形和坐标轴
fig, ax = plt.subplots()

# 添加 LineCollection 到坐标轴
ax.add_collection(lc)

# 设置坐标轴范围
ax.set_xlim(x.min(), x.max())
ax.set_ylim(y.min(), y.max())

# 设置标题和标签
ax.set_title('Color Change Based on Y Values - how2matplotlib.com')
ax.set_xlabel('X axis')
ax.set_ylabel('Y axis')

# 添加颜色条
sm = plt.cm.ScalarMappable(cmap='coolwarm', norm=norm)
sm.set_array([])
plt.colorbar(sm)

# 显示图形
plt.show()
在这个例子中,我们使用了 coolwarm 颜色映射来根据 y 值的大小动态改变线的颜色。这种方法可以直观地显示数据的变化趋势。
3.2 多段颜色变化
有时我们可能需要在一条线上使用多于两种的颜色。以下是一个实现多段颜色变化的例子:
import matplotlib.pyplot as plt
import numpy as np
from matplotlib.collections import LineCollection

# 生成数据
x = np.linspace(0, 10, 100)
y = np.sin(x)

# 创建线段
points = np.array([x, y]).T.reshape(-1, 1, 2)
segments = np.concatenate([points[:-1], points[1:]], axis=1)

# 创建颜色数组
colors = np.zeros((len(x), 4))
colors[:33] = [1, 0, 0, 1]  # 红色
colors[33:66] = [0, 1, 0, 1]  # 绿色
colors[66:] = [0, 0, 1, 1]  # 蓝色

# 创建 LineCollection
lc = LineCollection(segments, colors=colors, linewidth=2)

# 创建图形和坐标轴
fig, ax = plt.subplots()

# 添加 LineCollection 到坐标轴
ax.add_collection(lc)

# 设置坐标轴范围
ax.set_xlim(x.min(), x.max())
ax.set_ylim(y.min(), y.max())

# 设置标题和标签
ax.set_title('Multiple Color Segments - how2matplotlib.com')
ax.set_xlabel('X axis')
ax.set_ylabel('Y axis')

# 显示图形
plt.show()
Output:
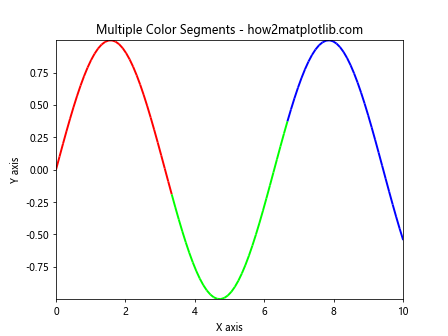
这个例子展示了如何在一条线上使用三种不同的颜色。我们通过创建一个颜色数组,并为不同的线段分配不同的颜色值来实现这一效果。
3.3 渐变色效果
我们还可以创建渐变色效果,使颜色在线条上平滑过渡:
import matplotlib.pyplot as plt
import numpy as np
from matplotlib.collections import LineCollection

# 生成数据
x = np.linspace(0, 10, 100)
y = np.sin(x)

# 创建线段
points = np.array([x, y]).T.reshape(-1, 1, 2)
segments = np.concatenate([points[:-1], points[1:]], axis=1)

# 创建渐变色
cmap = plt.get_cmap('viridis')
colors = cmap(np.linspace(0, 1, len(x)))

# 创建 LineCollection
lc = LineCollection(segments, colors=colors, linewidth=2)

# 创建图形和坐标轴
fig, ax = plt.subplots()

# 添加 LineCollection 到坐标轴
ax.add_collection(lc)

# 设置坐标轴范围
ax.set_xlim(x.min(), x.max())
ax.set_ylim(y.min(), y.max())

# 设置标题和标签
ax.set_title('Gradient Color Effect - how2matplotlib.com')
ax.set_xlabel('X axis')
ax.set_ylabel('Y axis')

# 添加颜色条
sm = plt.cm.ScalarMappable(cmap=cmap)
sm.set_array([])
plt.colorbar(sm)

# 显示图形
plt.show()
这个例子使用了 ‘viridis’ 颜色映射来创建一个平滑的渐变色效果。颜色从线条的起点到终点逐渐变化,提供了一种视觉上吸引人的效果。
3.4 基于时间的颜色变化
在时间序列数据可视化中,我们可能想要根据时间来改变线的颜色:
import matplotlib.pyplot as plt
import numpy as np
from matplotlib.collections import LineCollection
from matplotlib.colors import LinearSegmentedColormap

# 生成数据
np.random.seed(42)
dates = np.arange('2023-01-01', '2023-12-31', dtype='datetime64[D]')
values = np.cumsum(np.random.randn(len(dates)))

# 创建线段
points = np.array([dates.astype(float), values]).T.reshape(-1, 1, 2)
segments = np.concatenate([points[:-1], points[1:]], axis=1)

# 创建自定义颜色映射
colors = ['blue', 'green', 'yellow', 'red']
n_bins = len(colors)
cmap = LinearSegmentedColormap.from_list('custom', colors, N=n_bins)

# 创建颜色数组
norm = plt.Normalize(dates.min(), dates.max())
colors = cmap(norm(dates))

# 创建 LineCollection
lc = LineCollection(segments, colors=colors, linewidth=2)

# 创建图形和坐标轴
fig, ax = plt.subplots(figsize=(12, 6))

# 添加 LineCollection 到坐标轴
ax.add_collection(lc)

# 设置坐标轴范围和格式
ax.set_xlim(dates.min(), dates.max())
ax.set_ylim(values.min(), values.max())
ax.xaxis.set_major_locator(plt.MonthLocator())
ax.xaxis.set_major_formatter(plt.DateFormatter('%Y-%m'))

# 设置标题和标签
ax.set_title('Color Change Based on Time - how2matplotlib.com')
ax.set_xlabel('Date')
ax.set_ylabel('Value')

# 添加颜色条
sm = plt.cm.ScalarMappable(cmap=cmap, norm=norm)
sm.set_array([])
cbar = plt.colorbar(sm)
cbar.set_label('Time')

# 显示图形
plt.show()
这个例子展示了如何根据时间来改变线的颜色。我们使用自定义的颜色映射来表示时间的流逝,从蓝色(年初)逐渐过渡到红色(年末)。
3.5 突出显示特定区间
有时我们可能想要突出显示数据中的特定区间。以下是一个实现这一效果的例子:
import matplotlib.pyplot as plt
import numpy as np
from matplotlib.collections import LineCollection

# 生成数据
x = np.linspace(0, 10, 100)
y = np.sin(x)

# 定义要突出显示的区间
highlight_start = 3
highlight_end = 7

# 创建线段
points = np.array([x, y]).T.reshape(-1, 1, 2)
segments = np.concatenate([points[:-1], points[1:]], axis=1)

# 创建颜色数组
colors = np.where((x >= highlight_start) & (x <= highlight_end), 'red', 'blue')

# 创建 LineCollection
lc = LineCollection(segments, colors=colors, linewidth=2)

# 创建图形和坐标轴
fig, ax = plt.subplots()

# 添加 LineCollection 到坐标轴
ax.add_collection(lc)

# 设置坐标轴范围
ax.set_xlim(x.min(), x.max())
ax.set_ylim(y.min(), y.max())

# 设置标题和标签
ax.set_title('Highlighting Specific Interval - how2matplotlib.com')
ax.set_xlabel('X axis')
ax.set_ylabel('Y axis')

# 添加图例
ax.plot([], [], color='blue', label='Normal')
ax.plot([], [], color='red', label='Highlighted')
ax.legend()

# 显示图形
plt.show()
Output:
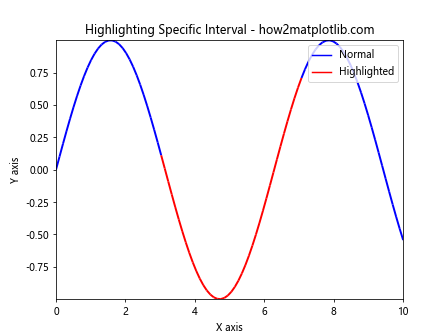
在这个例子中,我们定义了一个特定的区间(x 从 3 到 7),并使用红色突出显示这个区间,而其他部分保持蓝色。这种技术在需要强调数据中某个特定区间或事件时非常有用。
3.6 结合填充区域
我们可以结合线条的颜色变化和填充区域来创建更丰富的可视化效果:
import matplotlib.pyplot as plt
import numpy as np
from matplotlib.collections import LineCollection

# 生成数据
x = np.linspace(0, 10, 100)
y = np.sin(x)

## 创建线段
points = np.array([x, y]).T.reshape(-1, 1, 2)
segments = np.concatenate([points[:-1], points[1:]], axis=1)

# 创建颜色数组
colors = np.where(y >= 0, 'red', 'blue')

# 创建 LineCollection
lc = LineCollection(segments, colors=colors, linewidth=2)

# 创建图形和坐标轴
fig, ax = plt.subplots()

# 添加 LineCollection 到坐标轴
ax.add_collection(lc)

# 填充正值区域
ax.fill_between(x, y, 0, where=(y >= 0), color='red', alpha=0.3)

# 填充负值区域
ax.fill_between(x, y, 0, where=(y < 0), color='blue', alpha=0.3)

# 设置坐标轴范围
ax.set_xlim(x.min(), x.max())
ax.set_ylim(y.min(), y.max())

# 设置标题和标签
ax.set_title('Combining Color Change with Filled Areas - how2matplotlib.com')
ax.set_xlabel('X axis')
ax.set_ylabel('Y axis')

# 显示图形
plt.show()
Output:
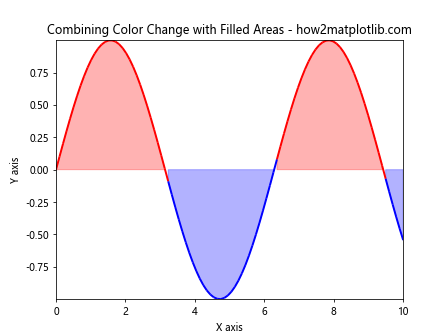
这个例子展示了如何结合线条颜色变化和填充区域。我们使用红色表示正值,蓝色表示负值,并用半透明的填充区域增强了视觉效果。这种技术在分析正负值变化或比较两个数据集时特别有用。
3.7 动态颜色变化
我们还可以创建一个动画效果,展示线条颜色的动态变化:
import matplotlib.pyplot as plt
import numpy as np
from matplotlib.animation import FuncAnimation
from matplotlib.collections import LineCollection

# 生成数据
x = np.linspace(0, 10, 100)
y = np.sin(x)

# 创建图形和坐标轴
fig, ax = plt.subplots()

# 创建初始 LineCollection
points = np.array([x, y]).T.reshape(-1, 1, 2)
segments = np.concatenate([points[:-1], points[1:]], axis=1)
lc = LineCollection(segments, linewidth=2)
line = ax.add_collection(lc)

# 设置坐标轴范围
ax.set_xlim(x.min(), x.max())
ax.set_ylim(y.min(), y.max())

# 设置标题和标签
ax.set_title('Dynamic Color Change - how2matplotlib.com')
ax.set_xlabel('X axis')
ax.set_ylabel('Y axis')

# 定义动画更新函数
def update(frame):
    colors = plt.cm.viridis(np.linspace(0, 1, len(x) - frame))
    lc.set_color(colors)
    return line,

# 创建动画
anim = FuncAnimation(fig, update, frames=len(x), interval=50, blit=True)

# 显示动画
plt.show()
Output:
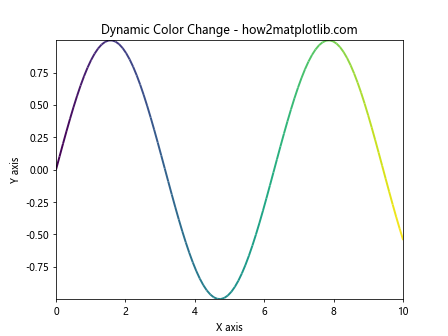
这个例子创建了一个动画,展示了线条颜色如何随时间动态变化。颜色从 ‘viridis’ 颜色映射的起始颜色逐渐过渡到结束颜色。这种动态效果可以用来展示数据的时间演变或强调数据的某些特征。
3.8 多条线的颜色变化
在某些情况下,我们可能需要在同一图表中显示多条线,每条线都有自己的颜色变化:
import matplotlib.pyplot as plt
import numpy as np
from matplotlib.collections import LineCollection

# 生成数据
x = np.linspace(0, 10, 100)
y1 = np.sin(x)
y2 = np.cos(x)

# 创建图形和坐标轴
fig, ax = plt.subplots()

# 为第一条线创建 LineCollection
points1 = np.array([x, y1]).T.reshape(-1, 1, 2)
segments1 = np.concatenate([points1[:-1], points1[1:]], axis=1)
colors1 = plt.cm.viridis(np.linspace(0, 1, len(x)))
lc1 = LineCollection(segments1, colors=colors1, linewidth=2)
ax.add_collection(lc1)

# 为第二条线创建 LineCollection
points2 = np.array([x, y2]).T.reshape(-1, 1, 2)
segments2 = np.concatenate([points2[:-1], points2[1:]], axis=1)
colors2 = plt.cm.plasma(np.linspace(0, 1, len(x)))
lc2 = LineCollection(segments2, colors=colors2, linewidth=2)
ax.add_collection(lc2)

# 设置坐标轴范围
ax.set_xlim(x.min(), x.max())
ax.set_ylim(min(y1.min(), y2.min()), max(y1.max(), y2.max()))

# 设置标题和标签
ax.set_title('Multiple Lines with Color Changes - how2matplotlib.com')
ax.set_xlabel('X axis')
ax.set_ylabel('Y axis')

# 添加图例
ax.plot([], [], color=colors1[0], label='Sin', linewidth=2)
ax.plot([], [], color=colors2[0], label='Cos', linewidth=2)
ax.legend()

# 显示图形
plt.show()
Output:
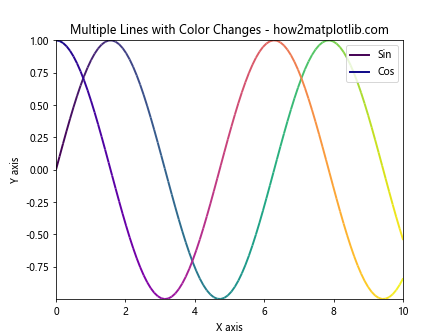
这个例子展示了如何在同一图表中绘制两条线,每条线都有自己的颜色变化。我们使用了不同的颜色映射(’viridis’ 和 ‘plasma’)来区分两条线。这种技术在比较多个数据集或展示多个变量的关系时非常有用。
3.9 颜色变化与数据特征结合
我们可以将颜色变化与数据的特定特征结合起来,以突出显示重要信息:
import matplotlib.pyplot as plt
import numpy as np
from matplotlib.collections import LineCollection

# 生成数据
x = np.linspace(0, 10, 100)
y = np.sin(x) * np.exp(-0.1 * x)

# 计算导数
dy = np.gradient(y, x)

# 创建线段
points = np.array([x, y]).T.reshape(-1, 1, 2)
segments = np.concatenate([points[:-1], points[1:]], axis=1)

# 创建颜色映射
norm = plt.Normalize(dy.min(), dy.max())
cmap = plt.get_cmap('coolwarm')
colors = cmap(norm(dy))

# 创建 LineCollection
lc = LineCollection(segments, colors=colors, linewidth=2)

# 创建图形和坐标轴
fig, ax = plt.subplots()

# 添加 LineCollection 到坐标轴
ax.add_collection(lc)

# 设置坐标轴范围
ax.set_xlim(x.min(), x.max())
ax.set_ylim(y.min(), y.max())

# 设置标题和标签
ax.set_title('Color Change Based on Derivative - how2matplotlib.com')
ax.set_xlabel('X axis')
ax.set_ylabel('Y axis')

# 添加颜色条
sm = plt.cm.ScalarMappable(cmap=cmap, norm=norm)
sm.set_array([])
cbar = plt.colorbar(sm)
cbar.set_label('Derivative')

# 显示图形
plt.show()
在这个例子中,我们根据函数的导数来改变线的颜色。红色表示导数为正(函数增加),蓝色表示导数为负(函数减少)。这种方法可以直观地显示函数的变化率,帮助识别关键点如极值和拐点。
3.10 结合其他 Matplotlib 特性
最后,我们可以将双色单线图与其他 Matplotlib 特性结合,创建更复杂和信息丰富的可视化:
import matplotlib.pyplot as plt
import numpy as np
from matplotlib.collections import LineCollection

# 生成数据
x = np.linspace(0, 10, 100)
y = np.sin(x) * np.exp(-0.1 * x)

# 创建线段
points = np.array([x, y]).T.reshape(-1, 1, 2)
segments = np.concatenate([points[:-1], points[1:]], axis=1)

# 创建颜色数组
colors = np.where(y >= 0, 'red', 'blue')

# 创建 LineCollection
lc = LineCollection(segments, colors=colors, linewidth=2)

# 创建图形和坐标轴
fig, ax = plt.subplots()

# 添加 LineCollection 到坐标轴
ax.add_collection(lc)

# 添加填充区域
ax.fill_between(x, y, 0, where=(y >= 0), color='red', alpha=0.3)
ax.fill_between(x, y, 0, where=(y < 0), color='blue', alpha=0.3)

# 添加关键点标注
max_point = x[np.argmax(y)]
ax.annotate(f'Max: ({max_point:.2f}, {y.max():.2f})',
            xy=(max_point, y.max()), xytext=(5, 1),
            arrowprops=dict(facecolor='black', shrink=0.05))

# 设置坐标轴范围
ax.set_xlim(x.min(), x.max())
ax.set_ylim(y.min(), y.max())

# 设置标题和标签
ax.set_title('Advanced Visualization with Two Colors One Line - how2matplotlib.com')
ax.set_xlabel('X axis')
ax.set_ylabel('Y axis')

# 添加网格线
ax.grid(True, linestyle='--', alpha=0.7)

# 添加图例
ax.plot([], [], color='red', label='Positive', linewidth=2)
ax.plot([], [], color='blue', label='Negative', linewidth=2)
ax.legend()

# 显示图形
plt.show()
Output:
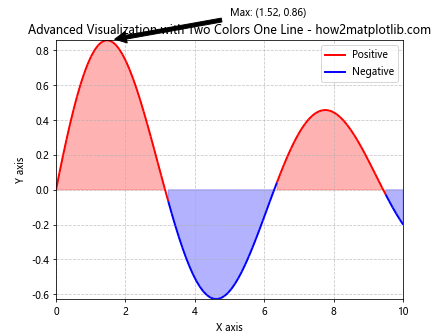
这个综合例子展示了如何将双色单线图与其他 Matplotlib 特性结合,包括填充区域、注释、网格线和图例。这种复杂的可视化可以提供更多的信息和上下文,使数据分析更加深入和全面。
4. 总结
通过本文的详细介绍和多个示例,我们探讨了如何在 Matplotlib 中创建双色单线图,以及如何将这种技术与其他可视化方法结合。这种技术在数据可视化中有广泛的应用,可以帮助我们更有效地传达信息,突出显示数据的重要特征。
主要要点包括:
- 使用 plot() 函数或 LineCollection 类来创建双色单线图
- 根据数据值、时间或其他条件动态改变线的颜色
- 创建多段颜色变化和渐变色效果
- 结合填充区域增强视觉效果
- 使用动画展示动态颜色变化
- 在同一图表中显示多条具有不同颜色变化的线
- 将颜色变化与数据特征(如导数)结合
- 整合其他 Matplotlib 特性创建复杂的可视化
通过掌握这些技术,你可以创建更加丰富、信息量大的数据可视化,帮助观众更好地理解和解释数据。记住,好的数据可视化不仅仅是美观,更重要的是能够有效地传达信息和洞察。在使用这些技术时,始终要考虑你的目标受众和你想要传达的核心信息。
最后,Matplotlib 是一个强大而灵活的库,本文介绍的技术只是其功能的一小部分。随着你对 Matplotlib 的深入学习和实践,你将能够创建出更加复杂和专业的数据可视化。
 极客教程
极客教程