Matplotlib 线型选项详解
参考:matplotlib linestyle options
matplotlib linestyle options
Matplotlib 是 Python 中最流行的数据可视化库之一,它提供了丰富的绘图功能和选项。其中,线型(linestyle)是绘制线图时最常用的属性之一。通过调整线型,我们可以创建各种不同风格的线条,使图表更加美观和富有表现力。本文将深入探讨 Matplotlib 中的线型选项,包括其基本用法、高级技巧以及实际应用案例。
1. 线型基础
在 Matplotlib 中,线型主要通过 linestyle 参数来控制。这个参数可以接受多种不同的值,包括预定义的字符串、短横线序列或自定义的线段/间隔序列。
1.1 预定义线型
Matplotlib 提供了几种预定义的线型,可以通过字符串来指定:
'-':实线(默认)'--':虚线'-.':点划线':':点线'None'、' '或'':不绘制线条
让我们通过一个示例来展示这些基本线型:
import matplotlib.pyplot as plt
import numpy as np

x = np.linspace(0, 10, 100)
y = np.sin(x)

plt.figure(figsize=(10, 6))
plt.plot(x, y, linestyle='-', label='Solid')
plt.plot(x, y + 1, linestyle='--', label='Dashed')
plt.plot(x, y + 2, linestyle='-.', label='Dash-dot')
plt.plot(x, y + 3, linestyle=':', label='Dotted')

plt.title('Basic Line Styles in Matplotlib - how2matplotlib.com')
plt.xlabel('X-axis')
plt.ylabel('Y-axis')
plt.legend()
plt.grid(True)
plt.show()

print("The plot has been displayed.")
Output:
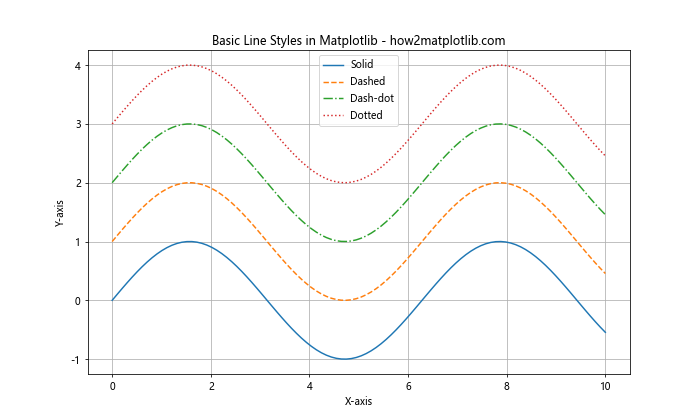
在这个示例中,我们创建了一个正弦波函数,并使用不同的线型绘制了四条曲线。每条曲线都有一个垂直偏移,以便清楚地区分它们。我们使用 label 参数为每条线添加了标签,并通过 plt.legend() 显示图例。
1.2 线型简写
为了方便使用,Matplotlib 还提供了一些线型的简写形式:
'-'可以简写为'solid''--'可以简写为'dashed''-.'可以简写为'dashdot'':'可以简写为'dotted'
这些简写形式可以在 linestyle 参数中直接使用。例如:
import matplotlib.pyplot as plt
import numpy as np

x = np.linspace(0, 10, 100)
y = np.cos(x)

plt.figure(figsize=(10, 6))
plt.plot(x, y, linestyle='solid', label='Solid')
plt.plot(x, y + 0.5, linestyle='dashed', label='Dashed')
plt.plot(x, y + 1, linestyle='dashdot', label='Dash-dot')
plt.plot(x, y + 1.5, linestyle='dotted', label='Dotted')

plt.title('Line Style Shortcuts in Matplotlib - how2matplotlib.com')
plt.xlabel('X-axis')
plt.ylabel('Y-axis')
plt.legend()
plt.grid(True)
plt.show()

print("The plot with line style shortcuts has been displayed.")
Output:
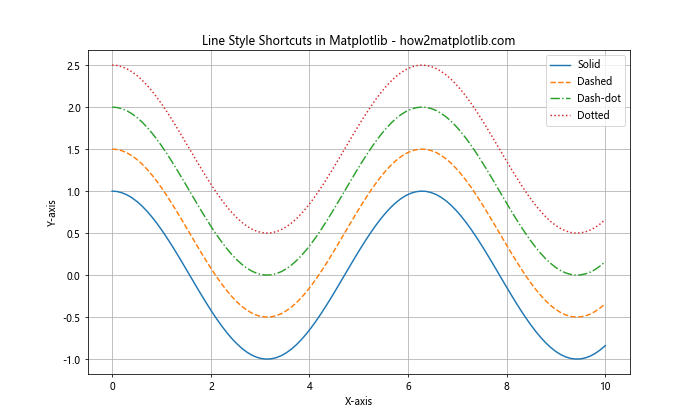
这个示例展示了如何使用线型的简写形式。我们绘制了一个余弦函数的四个变体,每个都使用不同的线型简写。
2. 自定义线型
除了预定义的线型,Matplotlib 还允许用户自定义线型。这可以通过指定线段和间隔的序列来实现。
2.1 使用 (on, off) 序列
最简单的自定义线型方法是使用 (on, off) 序列。这个序列定义了线段的长度和间隔的长度,单位是点(points)。例如:
import matplotlib.pyplot as plt
import numpy as np

x = np.linspace(0, 10, 100)
y = np.sin(x)

plt.figure(figsize=(10, 6))
plt.plot(x, y, linestyle=(0, (5, 5)), label='(5, 5)')
plt.plot(x, y + 1, linestyle=(0, (5, 1)), label='(5, 1)')
plt.plot(x, y + 2, linestyle=(0, (1, 1)), label='(1, 1)')
plt.plot(x, y + 3, linestyle=(0, (3, 5, 1, 5)), label='(3, 5, 1, 5)')

plt.title('Custom Line Styles in Matplotlib - how2matplotlib.com')
plt.xlabel('X-axis')
plt.ylabel('Y-axis')
plt.legend()
plt.grid(True)
plt.show()

print("The plot with custom line styles has been displayed.")
Output:
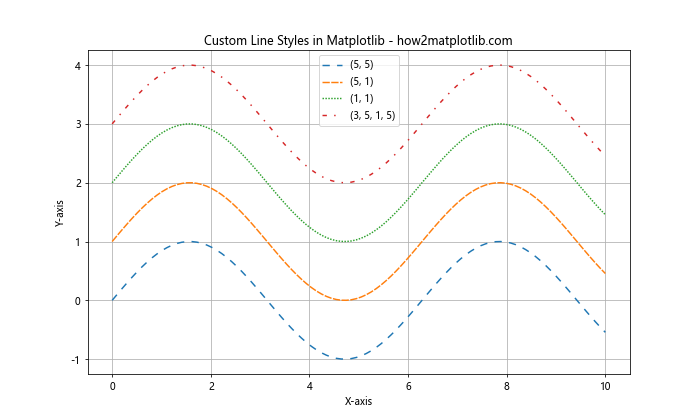
在这个示例中,我们定义了四种不同的自定义线型:
– (0, (5, 5)):5点线段,5点间隔
– (0, (5, 1)):5点线段,1点间隔
– (0, (1, 1)):1点线段,1点间隔(看起来像点线)
– (0, (3, 5, 1, 5)):3点线段,5点间隔,1点线段,5点间隔(重复)
这种方法允许我们创建各种复杂的线型模式。
2.2 使用 LineStyle 类
对于更复杂的自定义线型,我们可以使用 matplotlib.lines.LineStyle 类。这个类提供了更多的控制选项,包括线段的颜色和透明度。
import matplotlib.pyplot as plt
import numpy as np
from matplotlib.lines import LineStyle

x = np.linspace(0, 10, 100)
y = np.cos(x)

custom_style1 = LineStyle('--', dash_seq=[5, 2, 10, 2], dash_offset=0)
custom_style2 = LineStyle('-.', dash_seq=[10, 2, 2, 2], dash_offset=5)

plt.figure(figsize=(10, 6))
plt.plot(x, y, linestyle=custom_style1, label='Custom Style 1')
plt.plot(x, y + 0.5, linestyle=custom_style2, label='Custom Style 2')

plt.title('Advanced Custom Line Styles - how2matplotlib.com')
plt.xlabel('X-axis')
plt.ylabel('Y-axis')
plt.legend()
plt.grid(True)
plt.show()

print("The plot with advanced custom line styles has been displayed.")
在这个示例中,我们创建了两个自定义的 LineStyle 对象。custom_style1 是一个虚线样式,而 custom_style2 是一个点划线样式。我们可以通过调整 dash_seq 和 dash_offset 参数来精细控制线型的外观。
3. 线型与其他属性的组合
线型通常与其他线条属性一起使用,以创建更丰富的视觉效果。这些属性包括颜色、线宽、透明度等。
3.1 线型与颜色
我们可以同时设置线型和颜色来创建更具辨识度的图表:
import matplotlib.pyplot as plt
import numpy as np

x = np.linspace(0, 10, 100)
y = np.sin(x)

plt.figure(figsize=(10, 6))
plt.plot(x, y, linestyle='-', color='red', label='Solid Red')
plt.plot(x, y + 0.5, linestyle='--', color='green', label='Dashed Green')
plt.plot(x, y + 1, linestyle='-.', color='blue', label='Dash-dot Blue')
plt.plot(x, y + 1.5, linestyle=':', color='purple', label='Dotted Purple')

plt.title('Line Styles with Colors - how2matplotlib.com')
plt.xlabel('X-axis')
plt.ylabel('Y-axis')
plt.legend()
plt.grid(True)
plt.show()

print("The plot with line styles and colors has been displayed.")
Output:
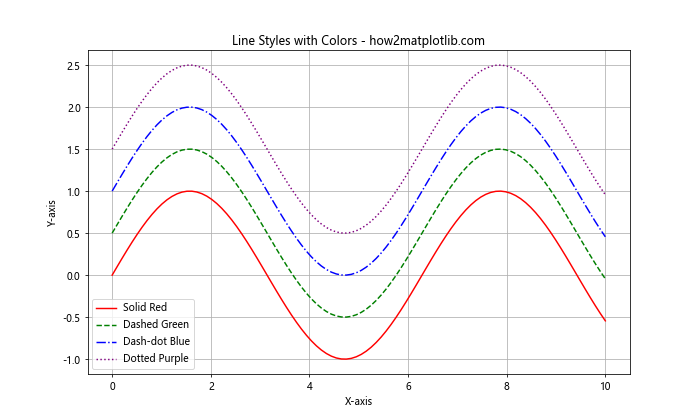
这个示例展示了如何将不同的线型与不同的颜色结合使用。这种组合可以帮助读者更容易地区分图表中的不同数据系列。
3.2 线型与线宽
调整线宽可以进一步增强线条的可见性和美观性:
import matplotlib.pyplot as plt
import numpy as np

x = np.linspace(0, 10, 100)
y = np.cos(x)

plt.figure(figsize=(10, 6))
plt.plot(x, y, linestyle='-', linewidth=1, label='Solid (1pt)')
plt.plot(x, y + 0.5, linestyle='--', linewidth=2, label='Dashed (2pt)')
plt.plot(x, y + 1, linestyle='-.', linewidth=3, label='Dash-dot (3pt)')
plt.plot(x, y + 1.5, linestyle=':', linewidth=4, label='Dotted (4pt)')

plt.title('Line Styles with Different Widths - how2matplotlib.com')
plt.xlabel('X-axis')
plt.ylabel('Y-axis')
plt.legend()
plt.grid(True)
plt.show()

print("The plot with line styles and different widths has been displayed.")
Output:
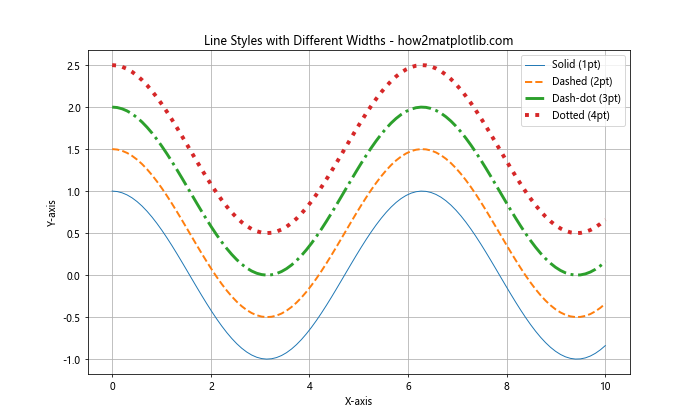
在这个示例中,我们为每种线型设置了不同的线宽。这不仅可以增加图表的层次感,还可以突出显示某些特定的数据系列。
3.3 线型与透明度
透明度(alpha)是另一个可以与线型结合使用的重要属性:
import matplotlib.pyplot as plt
import numpy as np

x = np.linspace(0, 10, 100)
y = np.sin(x)

plt.figure(figsize=(10, 6))
plt.plot(x, y, linestyle='-', alpha=1.0, label='Solid (100%)')
plt.plot(x, y, linestyle='--', alpha=0.7, label='Dashed (70%)')
plt.plot(x, y, linestyle='-.', alpha=0.4, label='Dash-dot (40%)')
plt.plot(x, y, linestyle=':', alpha=0.1, label='Dotted (10%)')

plt.title('Line Styles with Different Transparencies - how2matplotlib.com')
plt.xlabel('X-axis')
plt.ylabel('Y-axis')
plt.legend()
plt.grid(True)
plt.show()

print("The plot with line styles and different transparencies has been displayed.")
Output:
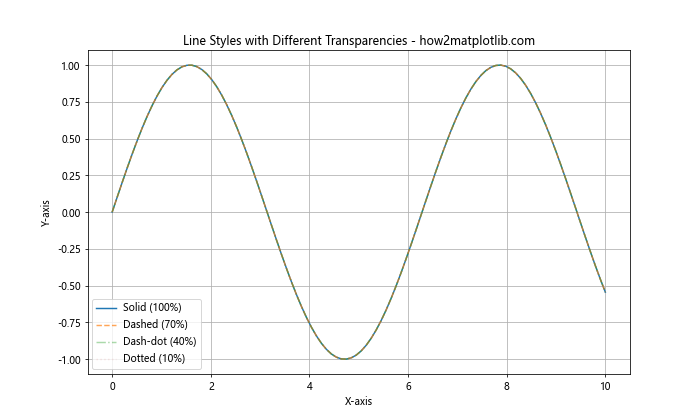
这个示例展示了如何将不同的透明度应用于相同的数据系列。这种技术在需要显示多个重叠数据系列时特别有用。
4. 高级线型技巧
除了基本的线型设置,Matplotlib 还提供了一些高级技巧,可以让我们的图表更加精美和富有表现力。
4.1 使用标记点
我们可以在线条上添加标记点来强调特定的数据点:
import matplotlib.pyplot as plt
import numpy as np

x = np.linspace(0, 10, 20)
y = np.sin(x)

plt.figure(figsize=(10, 6))
plt.plot(x, y, linestyle='-', marker='o', label='Solid with circles')
plt.plot(x, y + 0.5, linestyle='--', marker='s', label='Dashed with squares')
plt.plot(x, y + 1, linestyle='-.', marker='^', label='Dash-dot with triangles')
plt.plot(x, y + 1.5, linestyle=':', marker='*', label='Dotted with stars')

plt.title('Line Styles with Markers - how2matplotlib.com')
plt.xlabel('X-axis')
plt.ylabel('Y-axis')
plt.legend()
plt.grid(True)
plt.show()

print("The plot with line styles and markers has been displayed.")
Output:
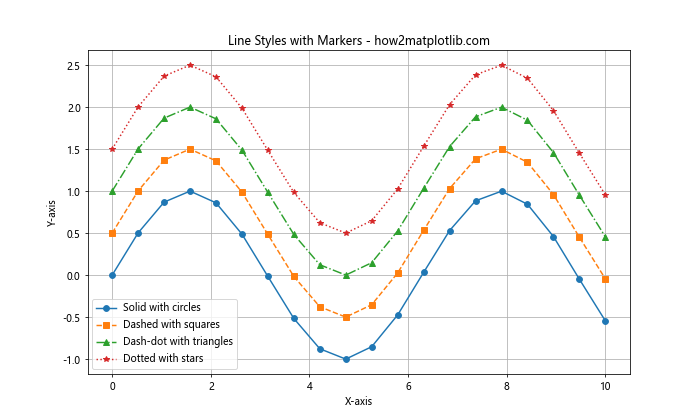
这个示例展示了如何在不同的线型上添加不同的标记点。这种组合可以帮助读者更容易地识别具体的数据点。
4.2 线型循环
当我们需要绘制多条线但又不想手动指定每条线的样式时,可以使用线型循环:
import matplotlib.pyplot as plt
import numpy as np
from cycler import cycler

x = np.linspace(0, 10, 100)
y_base = np.sin(x)

plt.figure(figsize=(10, 6))

# 定义线型循环
line_cycler = cycler(linestyle=['-', '--', '-.', ':'])
plt.gca().set_prop_cycle(line_cycler)

for i in range(4):
    plt.plot(x, y_base + i * 0.5, label=f'Line {i+1}')

plt.title('Automatic Line Style Cycling - how2matplotlib.com')
plt.xlabel('X-axis')
plt.ylabel('Y-axis')
plt.legend()
plt.grid(True)
plt.show()

print("The plot with automatic line style cycling has been displayed.")
Output:
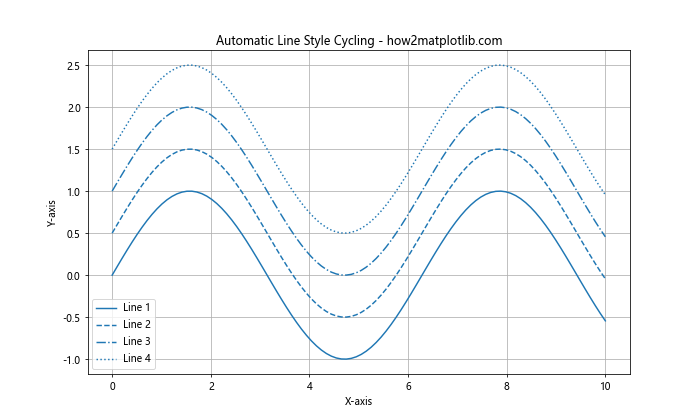
在这个示例中,我们使用 cycler 创建了一个线型循环,然后通过 set_prop_cycle 应用到当前的坐标轴。这样,每条新的线都会自动使用下一个线型,无需手动指定。
4.3 自定义虚线模式
我们可以创建更复杂的虚线模式来表达特定的信息:
import matplotlib.pyplot as plt
import numpy as np

x = np.linspace(0, 10, 100)
y = np.cos(x)

plt.figure(figsize=(10, 6))
plt.plot(x, y, linestyle=(0, (5, 1)), label='Dense dashed')
plt.plot(x, y + 0.5, linestyle=(0, (5, 5)), label='Equal dash-space')
plt.plot(x, y + 1, linestyle=(0, (5, 1, 1, 1)), label='Dash-dot-dot')
plt.plot(x, y + 1.5, linestyle=(0, (3, 5, 1, 5, 1, 5)), label='Complex pattern')

plt.title('Custom Dash Patterns - how2matplotlib.com')
plt.xlabel('X-axis')
plt.ylabel('Y-axis')
plt.legend()
plt.grid(True)
plt.show()

print("The plot with custom dash patterns has been displayed.")
Output:
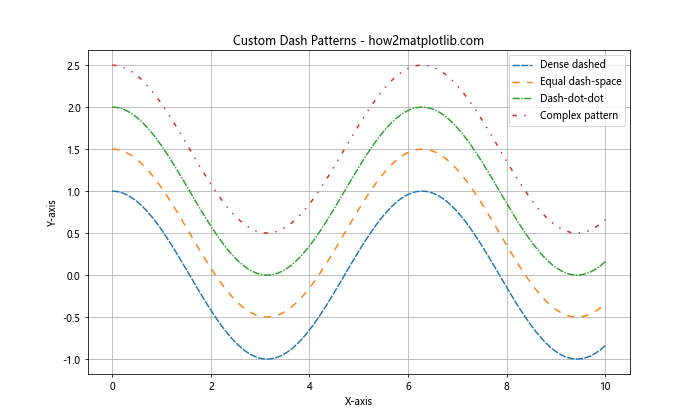
这个示例展示了如何创建各种复杂的虚线模式。通过调整线段和间隔的长度,我们可以创建出独特的线型,以满足特定的可视化需求。
5. 线型在不同类型图表中的应用
线型不仅可以用于简单的线图,还可以应用于其他类型的图表,如散点图、柱状图等。让我们看看如何在不同类型的图表中使用线型。
5.1 散点图中的线型
在散点图中,我们可以使用线型来连接数据点或添加趋势线:
import matplotlib.pyplot as plt
import numpy as np

np.random.seed(42)
x = np.linspace(0, 10, 50)
y = 2 * x + 1 + np.random.normal(0, 2, 50)

plt.figure(figsize=(10, 6))
plt.scatter(x, y, label='Data points')
plt.plot(x, 2*x + 1, linestyle='--', color='red', label='Trend line')

plt.title('Scatter Plot with Trend Line - how2matplotlib.com')
plt.xlabel('X-axis')
plt.ylabel('Y-axis')
plt.legend()
plt.grid(True)
plt.show()

print("The scatter plot with trend line has been displayed.")
Output:
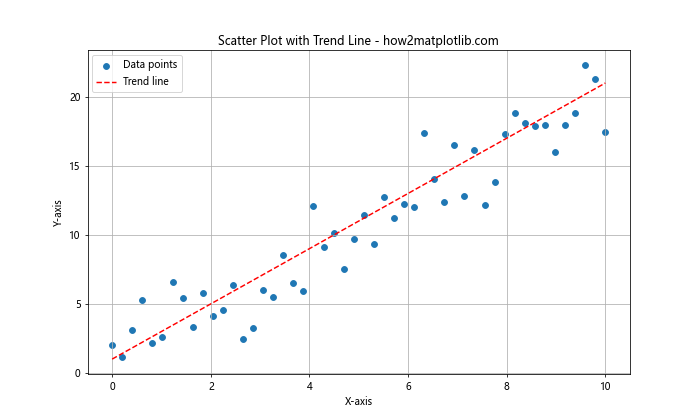
在这个示例中,我们创建了一个散点图,并添加了一条虚线趋势线。这种组合可以帮助读者更好地理解数据的整体趋势。
5.2 柱状图中的线型
虽然柱状图主要由矩形组成,但我们可以使用线型来添加额外的信息:
import matplotlib.pyplot as plt
import numpy as np

categories = ['A', 'B', 'C', 'D', 'E']
values = [3, 7, 2, 5, 8]
average = np.mean(values)

plt.figure(figsize=(10, 6))
plt.bar(categories, values, label='Values')
plt.axhline(y=average, linestyle='--', color='red', label='Average')

plt.title('Bar Chart with Average Line - how2matplotlib.com')
plt.xlabel('Categories')
plt.ylabel('Values')
plt.legend()
plt.grid(True, axis='y')
plt.show()

print("The bar chart with average line has been displayed.")
Output:
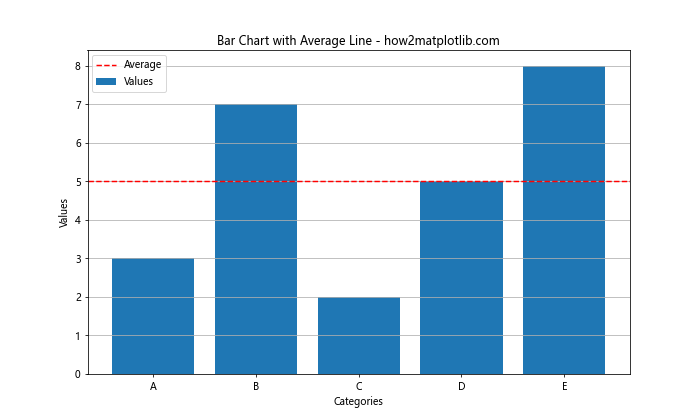
在这个示例中,我们创建了一个简单的柱状图,并添加了一条表示平均值的虚线。这种方法可以帮助读者快速比较各个类别与平均值的关系。
5.3 箱线图中的线型
箱线图中的线型可以用来强调特定的统计信息:
import matplotlib.pyplot as plt
import numpy as np

np.random.seed(42)
data = [np.random.normal(0, std, 100) for std in range(1, 5)]

plt.figure(figsize=(10, 6))
box_plot = plt.boxplot(data, patch_artist=True)

for median in box_plot['medians']:
    median.set(color='red', linewidth=2, linestyle='--')

for whisker in box_plot['whiskers']:
    whisker.set(linestyle='-.')

plt.title('Box Plot with Custom Line Styles - how2matplotlib.com')
plt.xlabel('Groups')
plt.ylabel('Values')
plt.grid(True, axis='y')
plt.show()

print("The box plot with custom line styles has been displayed.")
Output:
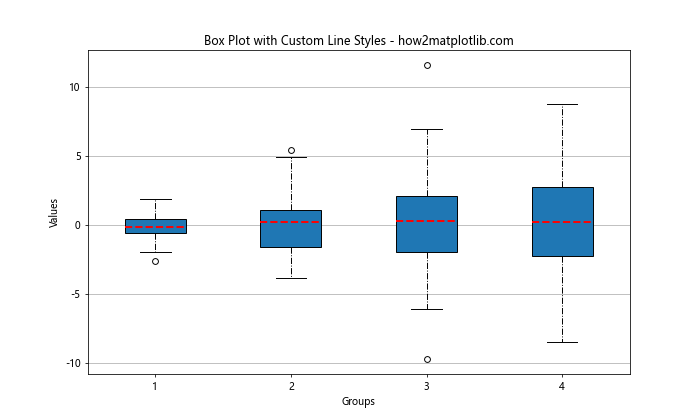
在这个示例中,我们自定义了箱线图的中位数线和须线的样式。中位数线使用红色虚线,而须线使用点划线。这种自定义可以帮助读者更容易地识别重要的统计信息。
6. 线型在时间序列数据中的应用
线型在时间序列数据的可视化中扮演着重要角色。不同的线型可以用来区分不同的时间段或数据特征。
6.1 多重时间序列
当我们需要在同一图表中显示多个时间序列时,不同的线型可以帮助区分它们:
import matplotlib.pyplot as plt
import numpy as np
import pandas as pd

# 创建示例数据
dates = pd.date_range(start='2023-01-01', end='2023-12-31', freq='D')
series1 = np.cumsum(np.random.randn(len(dates))) + 20
series2 = np.cumsum(np.random.randn(len(dates))) + 10
series3 = np.cumsum(np.random.randn(len(dates)))

plt.figure(figsize=(12, 6))
plt.plot(dates, series1, linestyle='-', label='Series 1')
plt.plot(dates, series2, linestyle='--', label='Series 2')
plt.plot(dates, series3, linestyle='-.', label='Series 3')

plt.title('Multiple Time Series with Different Line Styles - how2matplotlib.com')
plt.xlabel('Date')
plt.ylabel('Value')
plt.legend()
plt.grid(True)
plt.xticks(rotation=45)
plt.tight_layout()
plt.show()

print("The multiple time series plot has been displayed.")
Output:
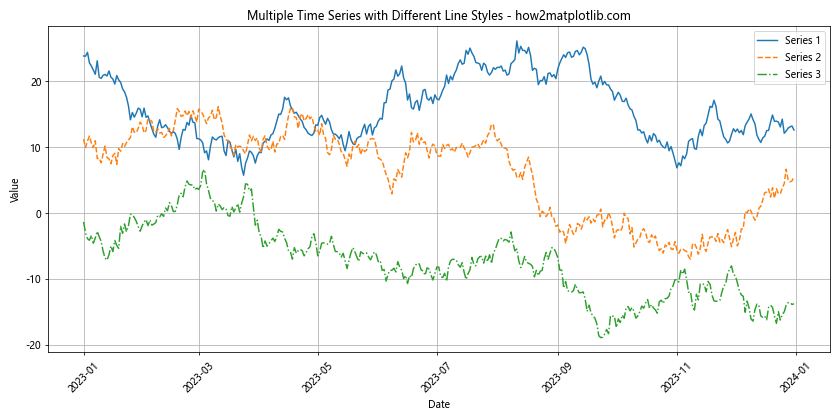
这个示例展示了如何使用不同的线型来区分三个不同的时间序列。这种方法在比较多个相关但不同的数据集时特别有用。
6.2 突出显示特定时间段
我们可以使用不同的线型来突出显示时间序列中的特定时间段:
import matplotlib.pyplot as plt
import numpy as np
import pandas as pd

# 创建示例数据
dates = pd.date_range(start='2023-01-01', end='2023-12-31', freq='D')
data = np.cumsum(np.random.randn(len(dates))) + 10

plt.figure(figsize=(12, 6))

# 绘制整体数据
plt.plot(dates, data, linestyle='-', color='blue', label='Full Series')

# 突出显示特定时间段
highlight_start = pd.to_datetime('2023-04-01')
highlight_end = pd.to_datetime('2023-06-30')
mask = (dates >= highlight_start) & (dates <= highlight_end)
plt.plot(dates[mask], data[mask], linestyle='--', color='red', linewidth=2, label='Highlighted Period')

plt.title('Time Series with Highlighted Period - how2matplotlib.com')
plt.xlabel('Date')
plt.ylabel('Value')
plt.legend()
plt.grid(True)
plt.xticks(rotation=45)
plt.tight_layout()
plt.show()

print("The time series plot with highlighted period has been displayed.")
Output:
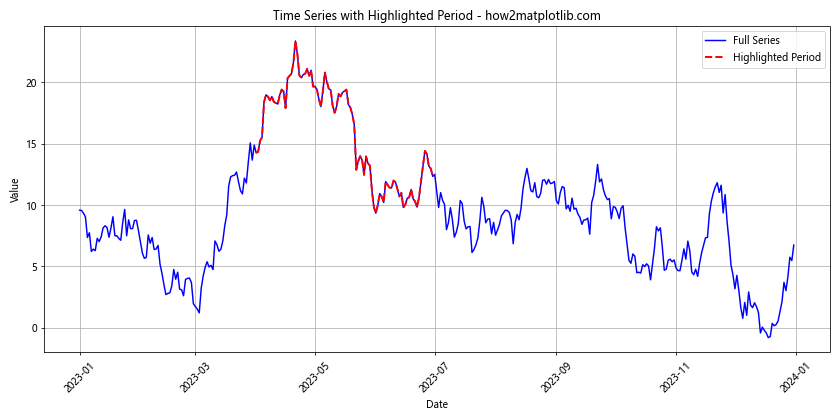
在这个示例中,我们使用实线绘制了整个时间序列,然后用虚线突出显示了特定的时间段(4月到6月)。这种技术可以用来强调某个特定时期的数据趋势或模式。
6.3 季节性数据的可视化
对于具有季节性的数据,我们可以使用不同的线型来表示不同的季节:
import matplotlib.pyplot as plt
import numpy as np
import pandas as pd

# 创建示例数据
dates = pd.date_range(start='2023-01-01', end='2025-12-31', freq='D')
base = np.sin(np.arange(len(dates)) * 2 * np.pi / 365.25) * 10 + 20
noise = np.random.randn(len(dates)) * 2
data = base + noise

plt.figure(figsize=(12, 6))

# 绘制整体数据
plt.plot(dates, data, linestyle='-', color='gray', alpha=0.5, label='Daily Data')

# 绘制每年的夏季数据
for year in range(2023, 2026):
    summer_start = pd.to_datetime(f'{year}-06-21')
    summer_end = pd.to_datetime(f'{year}-09-22')
    mask = (dates >= summer_start) & (dates <= summer_end)
    plt.plot(dates[mask], data[mask], linestyle='--', linewidth=2, label=f'Summer {year}')

plt.title('Seasonal Data Visualization - how2matplotlib.com')
plt.xlabel('Date')
plt.ylabel('Value')
plt.legend()
plt.grid(True)
plt.xticks(rotation=45)
plt.tight_layout()
plt.show()

print("The seasonal data visualization plot has been displayed.")
Output:
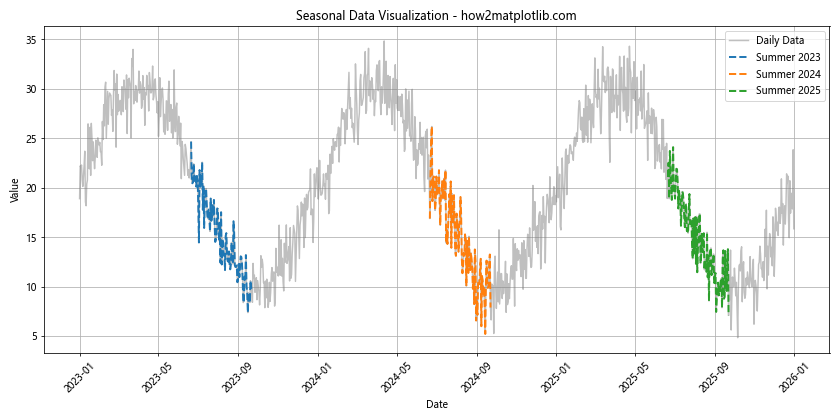
这个示例展示了如何使用不同的线型来突出显示每年的夏季数据。我们使用灰色实线表示整体数据,然后用彩色虚线突出显示每年的夏季。这种方法可以帮助读者更容易地识别和比较不同年份的季节性模式。
7. 线型在科学绘图中的应用
在科学绘图中,精确和清晰的线型表示对于传达复杂的信息至关重要。让我们探讨一些在科学可视化中使用线型的高级技巧。
7.1 相位图
在物理学和工程学中,相位图是一种常见的图表类型。不同的线型可以用来表示不同的相位关系:
import matplotlib.pyplot as plt
import numpy as np

t = np.linspace(0, 2*np.pi, 1000)
phase1 = np.sin(t)
phase2 = np.sin(t + np.pi/4)
phase3 = np.sin(t + np.pi/2)

plt.figure(figsize=(10, 6))
plt.plot(t, phase1, linestyle='-', label='Phase 0')
plt.plot(t, phase2, linestyle='--', label='Phase π/4')
plt.plot(t, phase3, linestyle='-.', label='Phase π/2')

plt.title('Phase Diagram - how2matplotlib.com')
plt.xlabel('Time')
plt.ylabel('Amplitude')
plt.legend()
plt.grid(True)
plt.show()

print("The phase diagram has been displayed.")
Output:
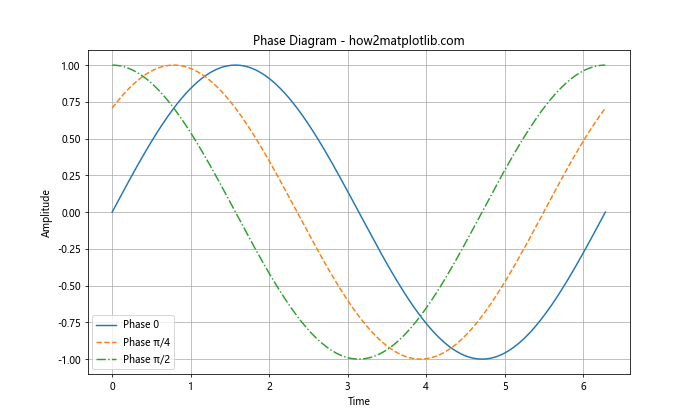
在这个示例中,我们使用不同的线型来表示三个不同相位的正弦波。这种表示方法可以清晰地展示波形之间的相位关系。
7.2 误差范围
在科学数据分析中,表示误差范围或置信区间是很常见的需求。我们可以使用不同的线型来区分中心趋势和误差范围:
import matplotlib.pyplot as plt
import numpy as np

x = np.linspace(0, 10, 100)
y = np.sin(x)
error = 0.1 + 0.2 * np.random.random(len(x))

plt.figure(figsize=(10, 6))
plt.plot(x, y, linestyle='-', label='Mean')
plt.fill_between(x, y-error, y+error, alpha=0.2)
plt.plot(x, y-error, linestyle='--', color='gray', label='Error Range')
plt.plot(x, y+error, linestyle='--', color='gray')

plt.title('Data with Error Range - how2matplotlib.com')
plt.xlabel('X-axis')
plt.ylabel('Y-axis')
plt.legend()
plt.grid(True)
plt.show()

print("The plot with error range has been displayed.")
Output:
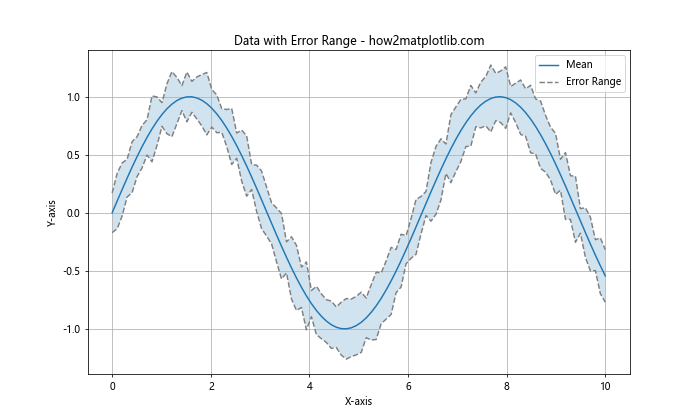
这个示例展示了如何使用实线表示数据的中心趋势,同时用虚线和填充区域表示误差范围。这种表示方法可以清晰地展示数据的不确定性。
7.3 多变量函数
对于多变量函数,我们可以使用不同的线型来表示不同的参数值:
import matplotlib.pyplot as plt
import numpy as np

x = np.linspace(-5, 5, 100)
y1 = x**2
y2 = x**2 + 2
y3 = x**2 + 4

plt.figure(figsize=(10, 6))
plt.plot(x, y1, linestyle='-', label='a=0')
plt.plot(x, y2, linestyle='--', label='a=2')
plt.plot(x, y3, linestyle='-.', label='a=4')

plt.title('Quadratic Function: f(x) = x² + a - how2matplotlib.com')
plt.xlabel('X-axis')
plt.ylabel('Y-axis')
plt.legend()
plt.grid(True)
plt.show()

print("The plot of quadratic functions has been displayed.")
Output:
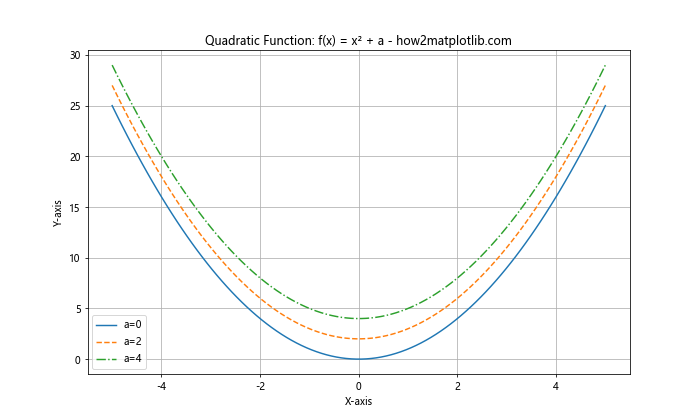
在这个示例中,我们使用不同的线型来表示二次函数 f(x) = x² + a 在不同 a 值下的图像。这种方法可以帮助读者直观地理解参数变化对函数图像的影响。
8. 线型在金融数据可视化中的应用
金融数据可视化是另一个广泛使用线型的领域。不同的线型可以用来表示不同类型的金融数据或指标。
8.1 股票价格和移动平均线
在股票分析中,我们经常需要同时显示股票价格和不同周期的移动平均线:
import matplotlib.pyplot as plt
import numpy as np
import pandas as pd

# 创建模拟的股票价格数据
dates = pd.date_range(start='2023-01-01', end='2023-12-31', freq='D')
price = 100 + np.cumsum(np.random.randn(len(dates))) / 10

# 计算移动平均线
ma_20 = price.rolling(window=20).mean()
ma_50 = price.rolling(window=50).mean()

plt.figure(figsize=(12, 6))
plt.plot(dates, price, linestyle='-', label='Stock Price')
plt.plot(dates, ma_20, linestyle='--', label='20-day MA')
plt.plot(dates, ma_50, linestyle='-.', label='50-day MA')

plt.title('Stock Price with Moving Averages - how2matplotlib.com')
plt.xlabel('Date')
plt.ylabel('Price')
plt.legend()
plt.grid(True)
plt.xticks(rotation=45)
plt.tight_layout()
plt.show()

print("The stock price chart with moving averages has been displayed.")
在这个示例中,我们使用实线表示股票价格,虚线表示20天移动平均线,点划线表示50天移动平均线。这种表示方法可以帮助投资者更好地理解股票价格的短期和中期趋势。
8.2 多只股票的比较
当需要比较多只股票的表现时,不同的线型可以帮助区分它们:
import matplotlib.pyplot as plt
import numpy as np
import pandas as pd

# 创建模拟的多只股票数据
dates = pd.date_range(start='2023-01-01', end='2023-12-31', freq='D')
stock1 = 100 + np.cumsum(np.random.randn(len(dates))) / 5
stock2 = 100 + np.cumsum(np.random.randn(len(dates))) / 5
stock3 = 100 + np.cumsum(np.random.randn(len(dates))) / 5

plt.figure(figsize=(12, 6))
plt.plot(dates, stock1, linestyle='-', label='Stock A')
plt.plot(dates, stock2, linestyle='--', label='Stock B')
plt.plot(dates, stock3, linestyle='-.', label='Stock C')

plt.title('Comparison of Multiple Stocks - how2matplotlib.com')
plt.xlabel('Date')
plt.ylabel('Price')
plt.legend()
plt.grid(True)
plt.xticks(rotation=45)
plt.tight_layout()
plt.show()

print("The comparison chart of multiple stocks has been displayed.")
Output:
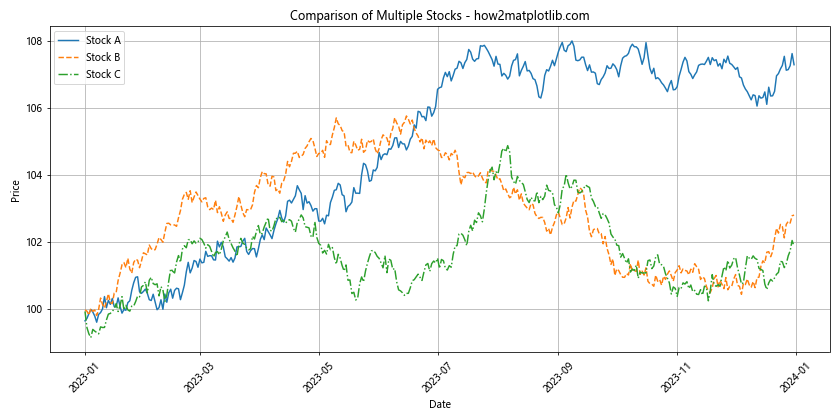
这个示例展示了如何使用不同的线型来比较三只不同股票的价格走势。这种方法可以帮助投资者直观地比较不同股票的表现。
8.3 金融指标的可视化
在金融分析中,我们经常需要同时显示多个相关的指标。不同的线型可以帮助区分这些指标:
import matplotlib.pyplot as plt
import numpy as np
import pandas as pd

# 创建模拟的金融数据
dates = pd.date_range(start='2023-01-01', end='2023-12-31', freq='D')
price = 100 + np.cumsum(np.random.randn(len(dates))) / 10
volume = np.random.randint(1000, 5000, len(dates))
volatility = np.abs(np.diff(price, prepend=price[0])) * 100

fig, (ax1, ax2, ax3) = plt.subplots(3, 1, figsize=(12, 15), sharex=True)

# 价格图
ax1.plot(dates, price, linestyle='-', label='Price')
ax1.set_ylabel('Price')
ax1.legend()
ax1.grid(True)

# 成交量图
ax2.bar(dates, volume, label='Volume', alpha=0.5)
ax2.set_ylabel('Volume')
ax2.legend()
ax2.grid(True)

# 波动率图
ax3.plot(dates, volatility, linestyle='--', label='Volatility')
ax3.set_ylabel('Volatility')
ax3.legend()
ax3.grid(True)

plt.title('Multiple Financial Indicators - how2matplotlib.com')
plt.xlabel('Date')
plt.xticks(rotation=45)
plt.tight_layout()
plt.show()

print("The chart with multiple financial indicators has been displayed.")
Output:
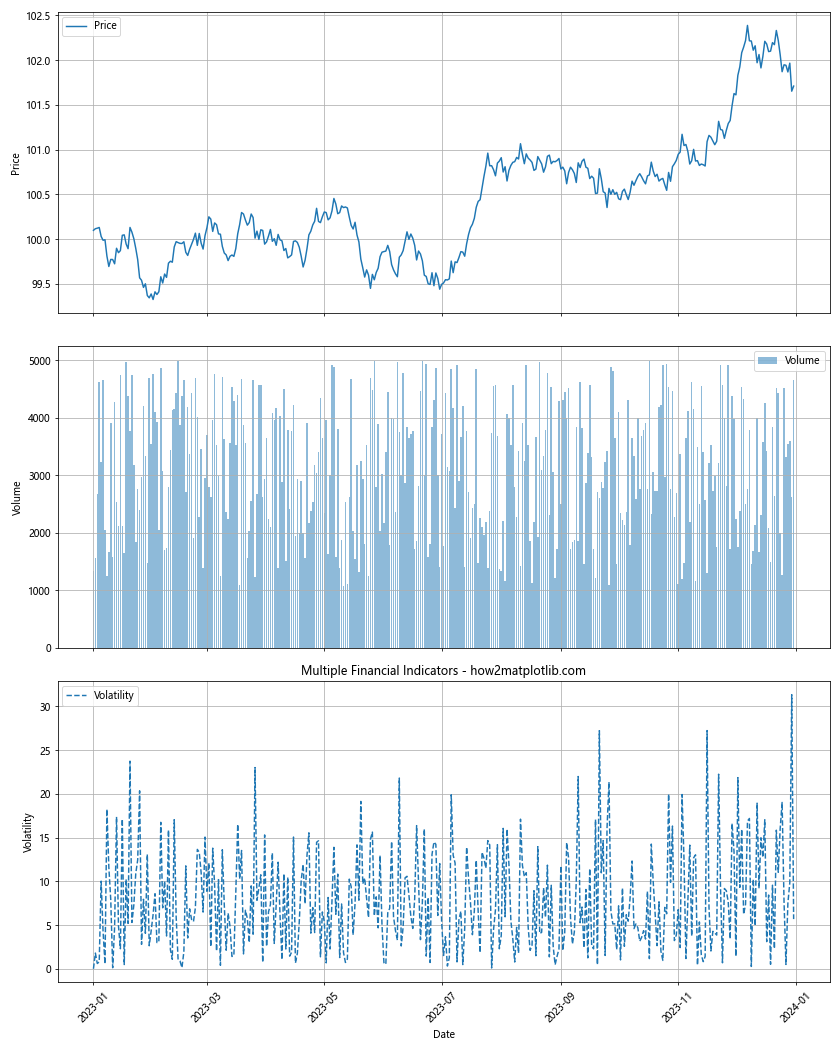
这个示例展示了如何在一个图表中同时显示股票价格、成交量和波动率。我们使用不同的图表类型和线型来区分这些指标,使得整体信息更加清晰和易于理解。
9. 线型在地理数据可视化中的应用
在地理数据可视化中,线型可以用来表示边界、路径或等高线等不同类型的地理特征。
9.1 地图边界
在绘制地图时,我们可以使用不同的线型来表示不同类型的边界:
import matplotlib.pyplot as plt
import numpy as np

# 模拟地图数据
x = np.linspace(0, 10, 100)
y1 = np.sin(x) + 5
y2 = np.cos(x) + 5
y3 = np.tan(x) / 10 + 5

plt.figure(figsize=(12, 8))
plt.plot(x, y1, linestyle='-', linewidth=2, label='Country Border')
plt.plot(x, y2, linestyle='--', linewidth=1.5, label='State Border')
plt.plot(x, y3, linestyle=':', linewidth=1, label='County Border')

plt.title('Map Boundaries - how2matplotlib.com')
plt.xlabel('Longitude')
plt.ylabel('Latitude')
plt.legend()
plt.grid(True)
plt.show()

print("The map boundaries chart has been displayed.")
Output:
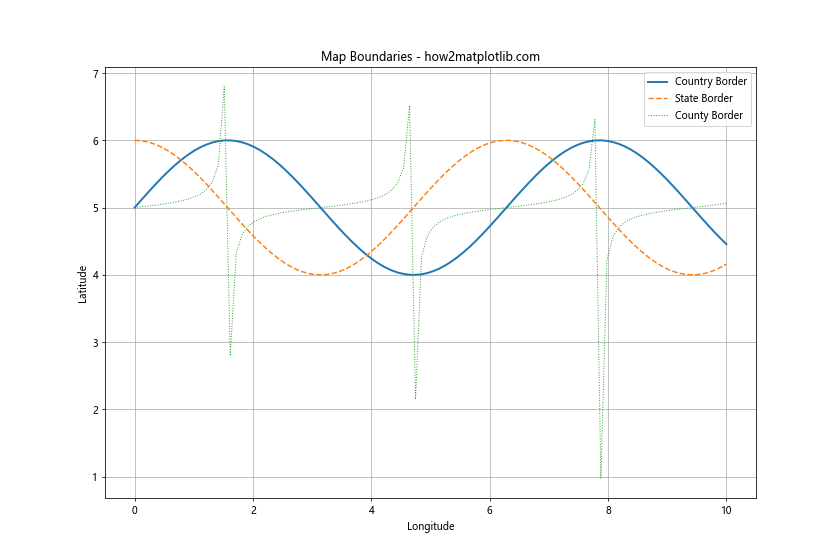
在这个示例中,我们使用不同的线型和线宽来表示不同级别的地理边界。实线表示国界,虚线表示州界,点线表示县界。这种方法可以帮助读者快速识别不同类型的地理边界。
9.2 等高线图
等高线图是地理数据可视化中的另一个重要应用:
import matplotlib.pyplot as plt
import numpy as np

# 创建示例数据
x = np.linspace(-5, 5, 100)
y = np.linspace(-5, 5, 100)
X, Y = np.meshgrid(x, y)
Z = np.sin(np.sqrt(X**2 + Y**2))

plt.figure(figsize=(10, 8))
contour = plt.contour(X, Y, Z, levels=15, cmap='viridis')
plt.clabel(contour, inline=True, fontsize=8)

plt.title('Contour Map - how2matplotlib.com')
plt.xlabel('X-axis')
plt.ylabel('Y-axis')
plt.colorbar(label='Elevation')
plt.grid(True)
plt.show()

print("The contour map has been displayed.")
Output:
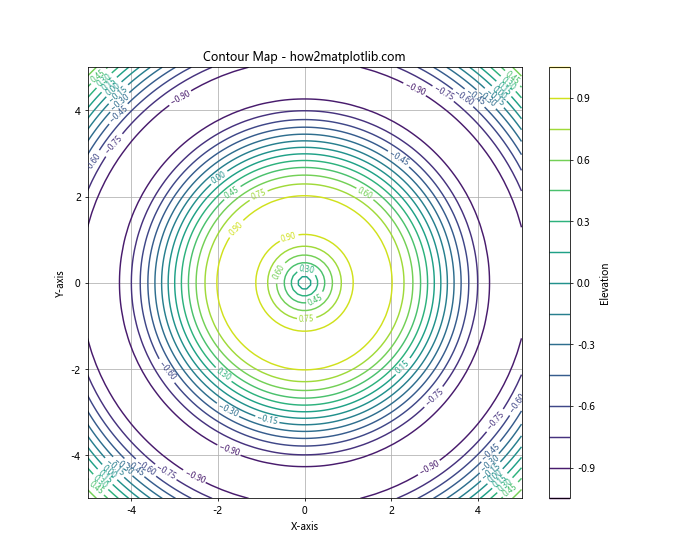
这个示例展示了如何创建一个等高线图。虽然这里没有直接使用 linestyle 参数,但 contour 函数会自动为不同高度的等高线使用不同的线型和颜色。
9.3 路径和轨迹
在地理数据可视化中,我们经常需要绘制路径或轨迹:
import matplotlib.pyplot as plt
import numpy as np

# 创建示例数据
t = np.linspace(0, 10, 100)
x1 = t * np.cos(t)
y1 = t * np.sin(t)
x2 = t * np.cos(t + np.pi/4)
y2 = t * np.sin(t + np.pi/4)

plt.figure(figsize=(10, 8))
plt.plot(x1, y1, linestyle='-', label='Path 1')
plt.plot(x2, y2, linestyle='--', label='Path 2')

plt.title('Paths and Trajectories - how2matplotlib.com')
plt.xlabel('X-coordinate')
plt.ylabel('Y-coordinate')
plt.legend()
plt.grid(True)
plt.axis('equal')
plt.show()

print("The paths and trajectories chart has been displayed.")
Output:
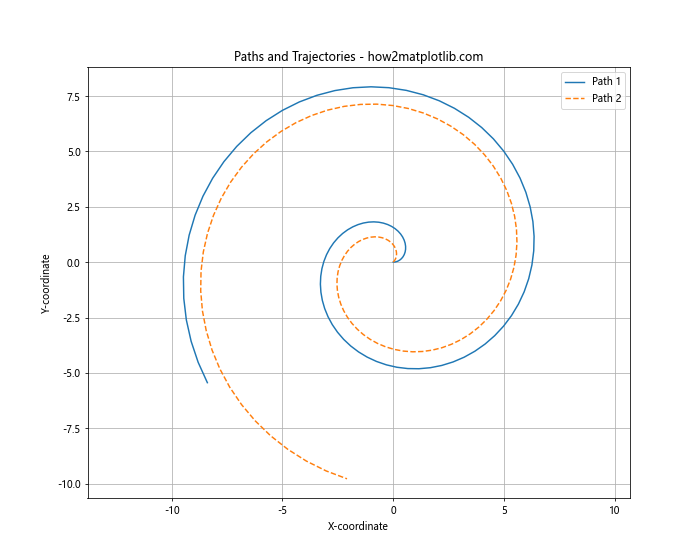
在这个示例中,我们使用不同的线型来表示两条不同的路径或轨迹。这种方法可以帮助读者区分和比较不同的移动路线。
10. 线型在网络图中的应用
网络图是一种用于表示实体之间关系的图表类型。在网络图中,线型可以用来表示不同类型的连接或关系强度。
10.1 基本网络图
让我们创建一个简单的网络图,使用不同的线型来表示不同类型的连接:
import matplotlib.pyplot as plt
import networkx as nx

G = nx.Graph()
G.add_edges_from([(1, 2), (1, 3), (2, 3), (3, 4), (4, 5), (5, 6), (4, 6)])

pos = nx.spring_layout(G)

plt.figure(figsize=(10, 8))
nx.draw_networkx_nodes(G, pos, node_color='lightblue', node_size=500)
nx.draw_networkx_labels(G, pos)

edge_styles = {(1, 2): '-', (1, 3): '--', (2, 3): '-.', (3, 4): ':', (4, 5): '-', (5, 6): '--', (4, 6): '-.'}

for edge, style in edge_styles.items():
    nx.draw_networkx_edges(G, pos, edgelist=[edge], style=style)

plt.title('Network Graph with Different Edge Styles - how2matplotlib.com')
plt.axis('off')
plt.tight_layout()
plt.show()

print("The network graph has been displayed.")
Output:
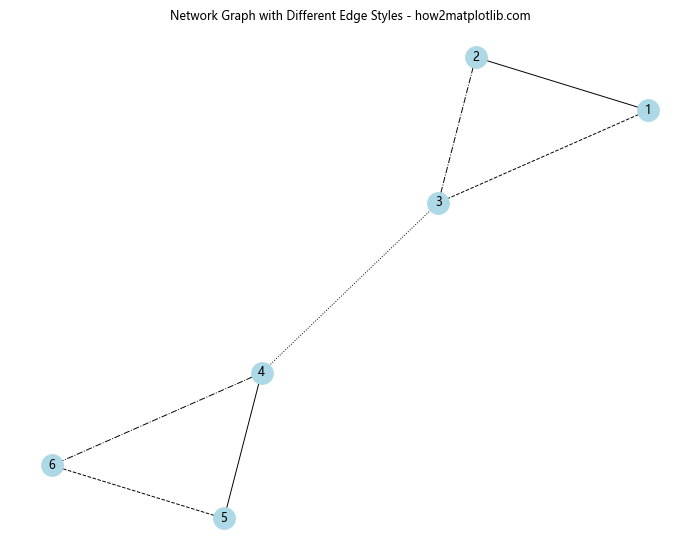
在这个示例中,我们创建了一个简单的网络图,并为不同的边使用了不同的线型。这种方法可以用来表示不同类型的关系或连接强度。
10.2 加权网络图
在加权网络图中,我们可以使用线型和线宽的组合来表示边的权重:
import matplotlib.pyplot as plt
import networkx as nx
import numpy as np

G = nx.Graph()
edges = [(1, 2, 0.1), (1, 3, 0.5), (2, 3, 0.9), (3, 4, 0.3), (4, 5, 0.7), (5, 6, 0.2), (4, 6, 0.6)]
G.add_weighted_edges_from(edges)

pos = nx.spring_layout(G)

plt.figure(figsize=(10, 8))
nx.draw_networkx_nodes(G, pos, node_color='lightgreen', node_size=500)
nx.draw_networkx_labels(G, pos)

for (u, v, d) in G.edges(data=True):
    weight = d['weight']
    if weight < 0.3:
        style = ':'
    elif weight < 0.6:
        style = '--'
    else:
        style = '-'
    nx.draw_networkx_edges(G, pos, edgelist=[(u, v)], width=weight*5, style=style)

plt.title('Weighted Network Graph - how2matplotlib.com')
plt.axis('off')
plt.tight_layout()
plt.show()

print("The weighted network graph has been displayed.")
Output:
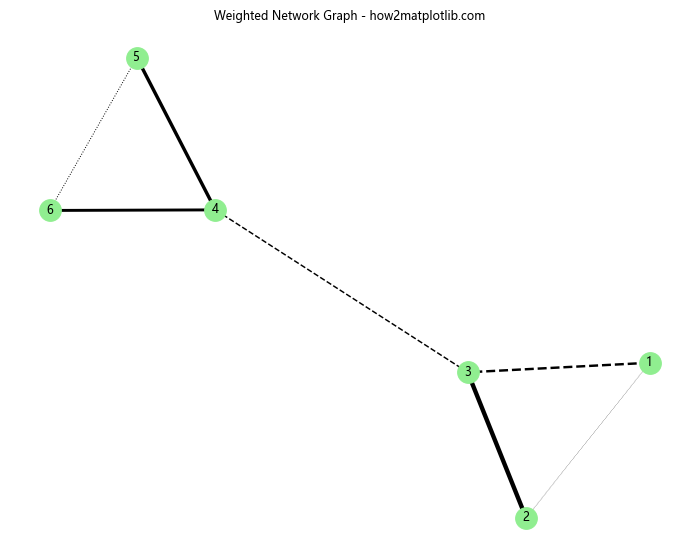
在这个示例中,我们使用线宽来表示边的权重,同时使用不同的线型来表示权重的范围。这种组合可以提供更丰富的视觉信息。
10.3 动态网络图
对于动态变化的网络,我们可以使用动画来展示网络的演变过程。虽然这超出了静态线型的范畴,但我们可以在每一帧中使用不同的线型:
import matplotlib.pyplot as plt
import networkx as nx
import matplotlib.animation as animation

def update(num):
    plt.clf()
    G = nx.gnp_random_graph(10, 0.2)
    pos = nx.spring_layout(G)
    nx.draw_networkx_nodes(G, pos, node_color='lightblue', node_size=500)
    nx.draw_networkx_labels(G, pos)

    for edge in G.edges():
        if sum(edge) % 2 == 0:
            style = '-'
        else:
            style = '--'
        nx.draw_networkx_edges(G, pos, edgelist=[edge], style=style)

    plt.title(f'Dynamic Network Graph - Frame {num+1} - how2matplotlib.com')
    plt.axis('off')

fig = plt.figure(figsize=(10, 8))
ani = animation.FuncAnimation(fig, update, frames=50, interval=500, repeat=True)
plt.close()  # 防止显示静态图

print("Animation object created. In a Jupyter notebook, you can display it using 'display(ani)'.")
这个示例创建了一个动态网络图的动画。在每一帧中,我们根据边的端点之和的奇偶性来选择不同的线型。这种方法可以用来展示网络结构随时间的变化。
11. 自定义线型
除了使用 Matplotlib 提供的预定义线型,我们还可以创建完全自定义的线型。这对于创建独特的视觉效果或表示特定的数据特征非常有用。
11.1 使用破折号序列
我们可以通过指定破折号序列来创建自定义线型:
import matplotlib.pyplot as plt
import numpy as np

x = np.linspace(0, 10, 100)
y = np.sin(x)

plt.figure(figsize=(12, 6))
plt.plot(x, y, linestyle=(0, (5, 2, 1, 2)), label='Custom Style 1')
plt.plot(x, y + 1, linestyle=(0, (3, 1, 1, 1, 1, 1)), label='Custom Style 2')
plt.plot(x, y + 2, linestyle=(0, (1, 10)), label='Custom Style 3')

plt.title('Custom Line Styles Using Dash Sequences - how2matplotlib.com')
plt.xlabel('X-axis')
plt.ylabel('Y-axis')
plt.legend()
plt.grid(True)
plt.show()

print("The plot with custom line styles has been displayed.")
Output:
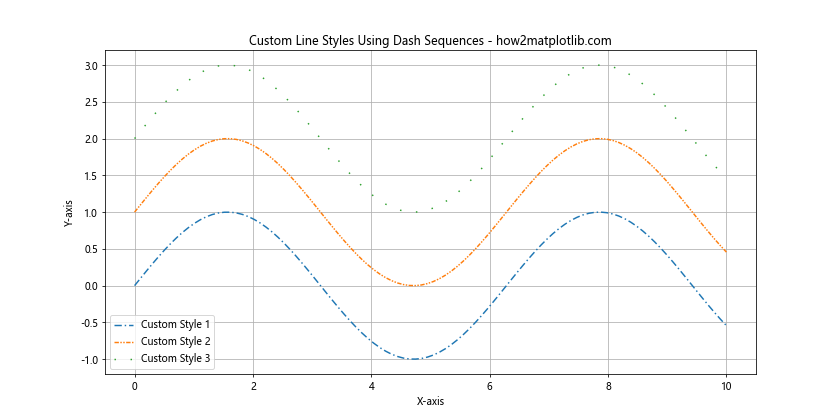
在这个示例中,我们创建了三种不同的自定义线型:
1. (0, (5, 2, 1, 2)): 5点线段,2点空白,1点线段,2点空白
2. (0, (3, 1, 1, 1, 1, 1)): 3点线段,1点空白,1点线段,1点空白,1点线段,1点空白
3. (0, (1, 10)): 1点线段,10点空白
这种方法允许我们创建几乎任何想要的线型模式。
11.2 使用标记点创建线型
另一种创建自定义线型的方法是使用标记点来模拟线段:
import matplotlib.pyplot as plt
import numpy as np

x = np.linspace(0, 10, 100)
y = np.cos(x)

plt.figure(figsize=(12, 6))
plt.plot(x, y, linestyle='', marker='o', markersize=2, markevery=5, label='Dot Line')
plt.plot(x, y + 0.5, linestyle='', marker='|', markersize=10, markevery=3, label='Vertical Line')
plt.plot(x, y + 1, linestyle='', marker='_', markersize=10, markevery=4, label='Horizontal Line')

plt.title('Custom Line Styles Using Markers - how2matplotlib.com')
plt.xlabel('X-axis')
plt.ylabel('Y-axis')
plt.legend()
plt.grid(True)
plt.show()

print("The plot with custom line styles using markers has been displayed.")
Output:
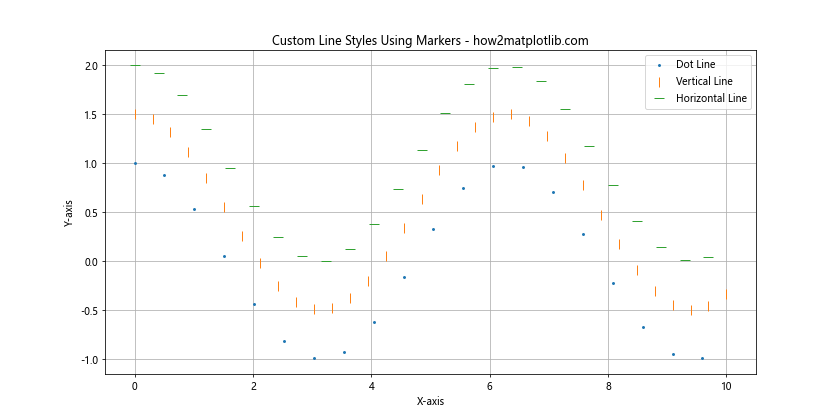
在这个示例中,我们使用不同的标记点和 markevery 参数来创建三种不同的线型效果:
1. 点线:使用小圆点标记
2. 垂直线:使用垂直线段标记
3. 水平线:使用水平线段标记
这种方法特别适合创建点线或虚线效果。
11.3 组合线型和标记
我们还可以将自定义线型与标记点结合使用,创造出更复杂的视觉效果:
import matplotlib.pyplot as plt
import numpy as np

x = np.linspace(0, 10, 50)
y = np.sin(x)

plt.figure(figsize=(12, 6))
plt.plot(x, y, linestyle=(0, (5, 2)), marker='o', markevery=5, label='Style 1')
plt.plot(x, y + 0.5, linestyle=(0, (1, 1)), marker='s', markevery=3, label='Style 2')
plt.plot(x, y + 1, linestyle=(0, (3, 1, 1, 1)), marker='^', markevery=4, label='Style 3')

plt.title('Combined Custom Line Styles and Markers - how2matplotlib.com')
plt.xlabel('X-axis')
plt.ylabel('Y-axis')
plt.legend()
plt.grid(True)
plt.show()

print("The plot with combined custom line styles and markers has been displayed.")
Output:
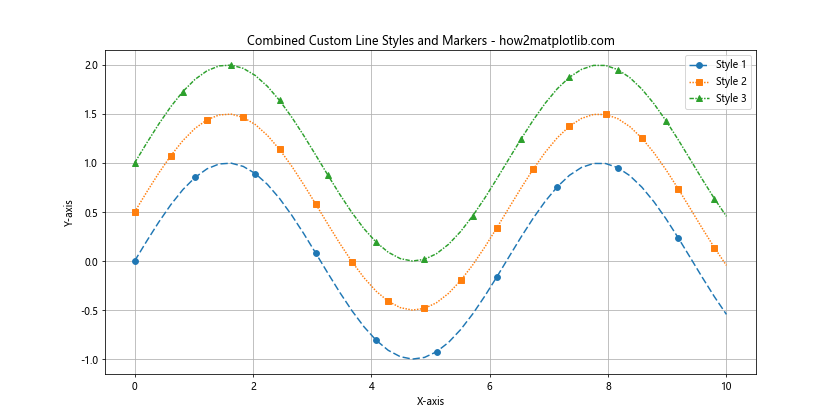
这个示例展示了如何将自定义线型与不同的标记点结合使用。这种组合可以创造出非常独特和信息丰富的线型效果。
12. 线型在 3D 图形中的应用
虽然我们主要讨论了 2D 图形中的线型,但线型在 3D 图形中同样重要。让我们看看如何在 3D 图形中应用不同的线型。
12.1 3D 线图
在 3D 空间中绘制线条时,我们同样可以使用不同的线型:
import matplotlib.pyplot as plt
import numpy as np

fig = plt.figure(figsize=(12, 8))
ax = fig.add_subplot(111, projection='3d')

t = np.linspace(0, 10, 100)
x = np.sin(t)
y = np.cos(t)
z = t

ax.plot(x, y, z, linestyle='-', label='Solid')
ax.plot(x, y, z + 2, linestyle='--', label='Dashed')
ax.plot(x, y, z + 4, linestyle='-.', label='Dash-dot')

ax.set_xlabel('X-axis')
ax.set_ylabel('Y-axis')
ax.set_zlabel('Z-axis')
ax.legend()
ax.set_title('3D Line Styles - how2matplotlib.com')

plt.show()

print("The 3D line plot has been displayed.")
Output:
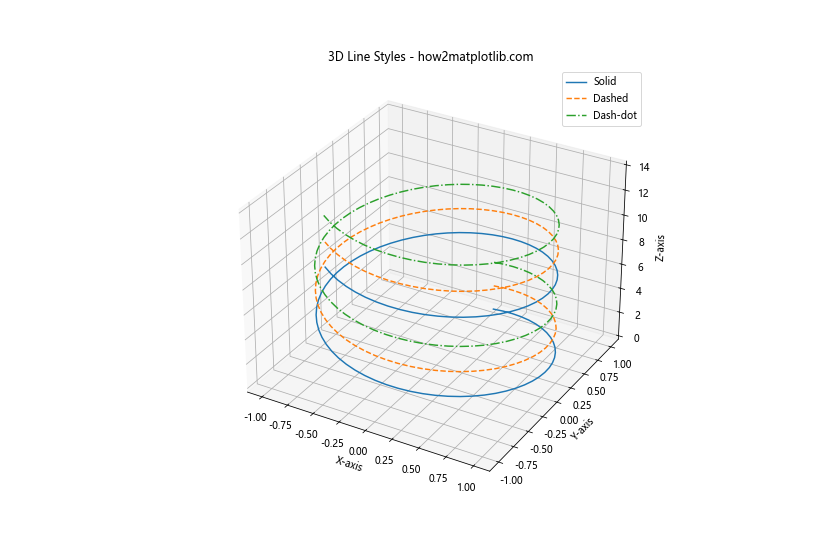
这个示例展示了如何在 3D 空间中使用不同的线型绘制螺旋线。
12.2 3D 表面图的等高线
在 3D 表面图中,我们可以使用不同的线型来表示等高线:
import matplotlib.pyplot as plt
import numpy as np

fig = plt.figure(figsize=(12, 8))
ax = fig.add_subplot(111, projection='3d')

x = np.linspace(-5, 5, 100)
y = np.linspace(-5, 5, 100)
X, Y = np.meshgrid(x, y)
Z = np.sin(np.sqrt(X**2 + Y**2))

surf = ax.plot_surface(X, Y, Z, cmap='viridis', alpha=0.8)

ax.contour(X, Y, Z, zdir='z', offset=-2, cmap='viridis', linestyles=['solid', 'dashed', 'dashdot', 'dotted'])

ax.set_xlabel('X-axis')
ax.set_ylabel('Y-axis')
ax.set_zlabel('Z-axis')
ax.set_title('3D Surface with Contour Lines - how2matplotlib.com')

plt.colorbar(surf)
plt.show()

print("The 3D surface plot with contour lines has been displayed.")
Output:
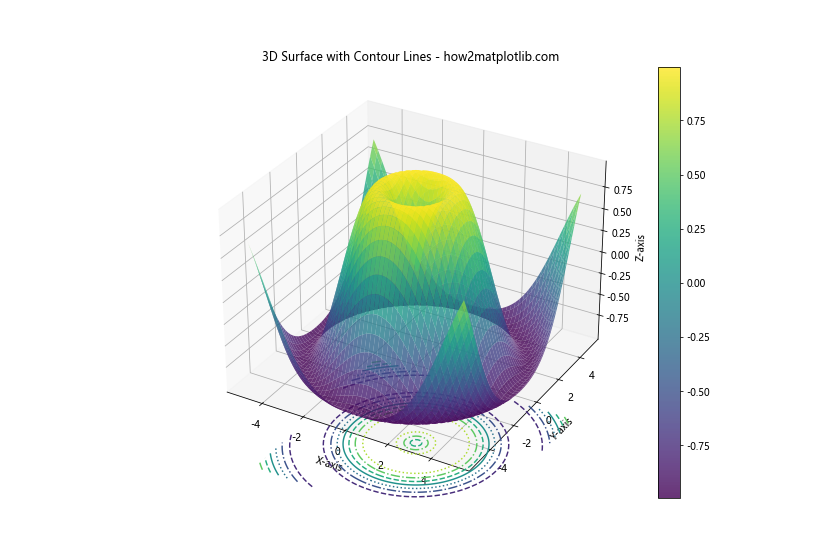
在这个示例中,我们创建了一个 3D 表面图,并在底部添加了使用不同线型的等高线。这种方法可以帮助读者更好地理解 3D 表面的形状和特征。
12.3 3D 散点图与连接线
在 3D 散点图中,我们可以使用不同的线型来连接数据点:
import matplotlib.pyplot as plt
import numpy as np

fig = plt.figure(figsize=(12, 8))
ax = fig.add_subplot(111, projection='3d')

n = 100
x = np.random.rand(n)
y = np.random.rand(n)
z = np.random.rand(n)

ax.scatter(x, y, z, c='r', marker='o')

for i in range(n-1):
    if i % 3 == 0:
        linestyle = '-'
    elif i % 3 == 1:
        linestyle = '--'
    else:
        linestyle = '-.'
    ax.plot([x[i], x[i+1]], [y[i], y[i+1]], [z[i], z[i+1]], linestyle=linestyle)

ax.set_xlabel('X-axis')
ax.set_ylabel('Y-axis')
ax.set_zlabel('Z-axis')
ax.set_title('3D Scatter Plot with Connecting Lines - how2matplotlib.com')

plt.show()

print("The 3D scatter plot with connecting lines has been displayed.")
Output:
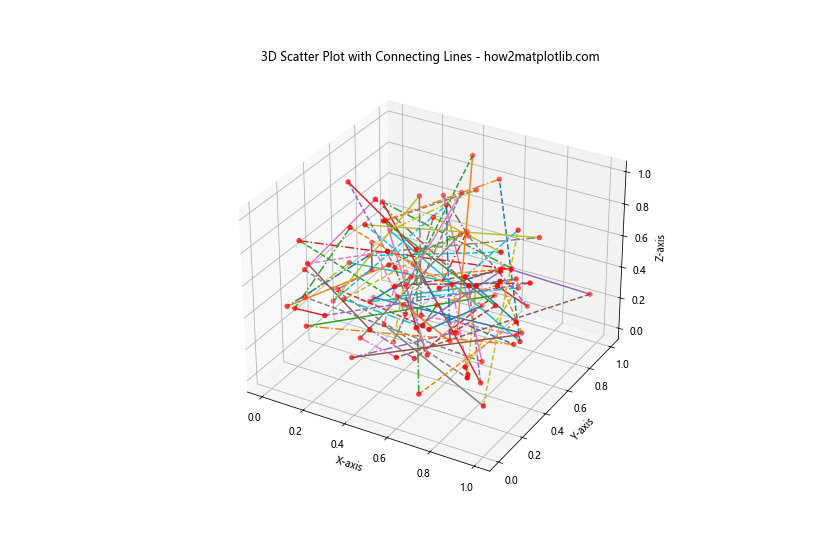
这个示例创建了一个 3D 散点图,并使用不同的线型连接相邻的点。这种方法可以用来展示数据点之间的关系或路径。
13. 线型在动画中的应用
动画是数据可视化的一个强大工具,可以展示数据随时间的变化。在动画中使用不同的线型可以增加信息的丰富度。
13.1 简单的线型动画
让我们创建一个简单的动画,展示不同线型的绘制过程:
import matplotlib.pyplot as plt
import numpy as np
import matplotlib.animation as animation

fig, ax = plt.subplots(figsize=(10, 6))

x = np.linspace(0, 2*np.pi, 100)
line1, = ax.plot([], [], 'r-', label='Solid')
line2, = ax.plot([], [], 'b--', label='Dashed')
line3, = ax.plot([], [], 'g-.', label='Dash-dot')

ax.set_xlim(0, 2*np.pi)
ax.set_ylim(-1.5, 1.5)
ax.legend()

def init():
    line1.set_data([], [])
    line2.set_data([], [])
    line3.set_data([], [])
    return line1, line2, line3

def animate(i):
    t = x[:i]
    line1.set_data(t, np.sin(t))
    line2.set_data(t, np.cos(t))
    line3.set_data(t, np.sin(2*t))
    return line1, line2, line3

ani = animation.FuncAnimation(fig, animate, frames=len(x), init_func=init, blit=True, interval=50)

plt.title('Animated Line Styles - how2matplotlib.com')
plt.close()  # 防止显示静态图

print("Animation object created. In a Jupyter notebook, you can display it using 'display(ani)'.")
这个动画展示了三种不同线型的曲线随时间逐渐绘制的过程。
13.2 线型切换动画
我们还可以创建一个动画,展示线型随时间变化的效果:
import matplotlib.pyplot as plt
import numpy as np
import matplotlib.animation as animation

fig, ax = plt.subplots(figsize=(10, 6))

x = np.linspace(0, 2*np.pi, 100)
y = np.sin(x)

line, = ax.plot([], [], 'r-', lw=2)

ax.set_xlim(0, 2*np.pi)
ax.set_ylim(-1.1, 1.1)

styles = ['-', '--', '-.', ':']

def init():
    line.set_data([], [])
    return line,

def animate(i):
    line.set_data(x, y)
    line.set_linestyle(styles[i % len(styles)])
    ax.set_title(f'Current Line Style: {styles[i % len(styles)]} - how2matplotlib.com')
    return line,

ani = animation.FuncAnimation(fig, animate, frames=20, init_func=init, blit=True, interval=500)

plt.close()  # 防止显示静态图

print("Animation object created. In a Jupyter notebook, you can display it using 'display(ani)'.")
这个动画展示了同一条曲线在不同线型之间切换的效果。
14. 线型在特殊图表中的应用
某些特殊类型的图表可能需要独特的线型应用。让我们探讨一些这样的例子。
14.1 极坐标图
在极坐标图中,我们可以使用不同的线型来区分不同的数据系列:
import matplotlib.pyplot as plt
import numpy as np

r = np.arange(0, 2, 0.01)
theta = 2 * np.pi * r

fig, ax = plt.subplots(subplot_kw=dict(projection='polar'), figsize=(10, 10))
ax.plot(theta, r, linestyle='-', label='Spiral 1')
ax.plot(theta, r+0.5, linestyle='--', label='Spiral 2')
ax.plot(theta, r+1, linestyle='-.', label='Spiral 3')

ax.set_rmax(2)
ax.set_rticks([0.5, 1, 1.5, 2])
ax.set_rlabel_position(-22.5)
ax.grid(True)

ax.set_title("Polar Plot with Different Line Styles - how2matplotlib.com")
ax.legend()

plt.show()

print("The polar plot has been displayed.")
Output:
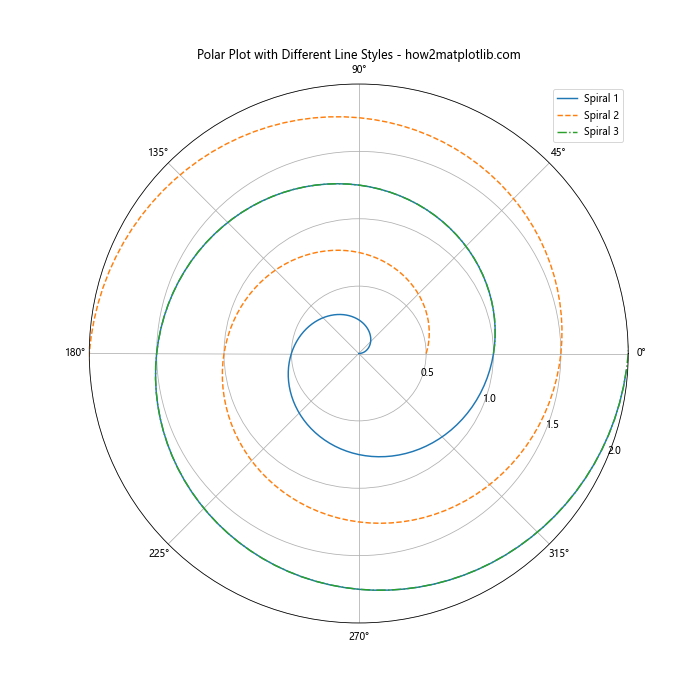
这个示例展示了如何在极坐标系中使用不同的线型绘制螺旋线。
14.2 雷达图
雷达图(也称为蜘蛛图或星图)是另一种可以应用不同线型的特殊图表:
import matplotlib.pyplot as plt
import numpy as np

categories = ['A', 'B', 'C', 'D', 'E', 'F']
values1 = [4, 3, 5, 2, 4, 3]
values2 = [3, 4, 2, 5, 3, 4]

angles = np.linspace(0, 2*np.pi, len(categories), endpoint=False)
values1 = np.concatenate((values1, [values1[0]]))
values2 = np.concatenate((values2, [values2[0]]))
angles = np.concatenate((angles, [angles[0]]))

fig, ax = plt.subplots(figsize=(8, 8), subplot_kw=dict(projection='polar'))
ax.plot(angles, values1, 'o-', linewidth=2, label='Series 1')
ax.plot(angles, values2, 's--', linewidth=2, label='Series 2')
ax.fill(angles, values1, alpha=0.25)
ax.fill(angles, values2, alpha=0.25)

ax.set_thetagrids(angles[:-1] * 180/np.pi, categories)
ax.set_ylim(0, 6)
ax.set_title("Radar Chart with Different Line Styles - how2matplotlib.com")
ax.legend(loc='upper right', bbox_to_anchor=(1.3, 1.0))

plt.show()

print("The radar chart has been displayed.")
Output:
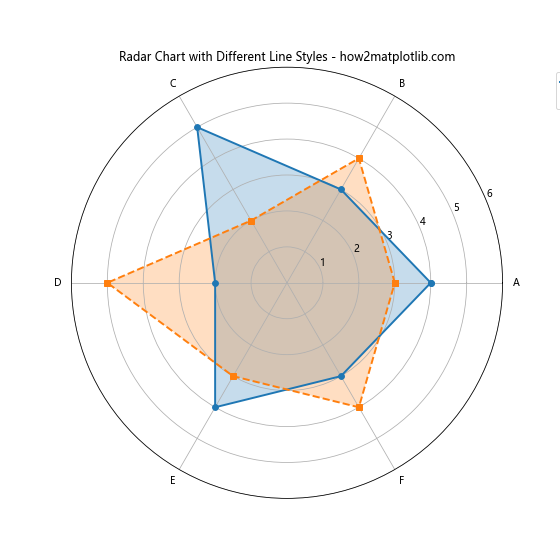
这个雷达图示例展示了如何使用不同的线型和标记来区分两个数据系列。
14.3 树状图
在树状图中,我们可以使用不同的线型来表示不同层级的连接:
import matplotlib.pyplot as plt
import numpy as np

def draw_tree(ax, node, x, y, dx, dy, level=0):
    if level > 3:
        return

    left_child = (x - dx, y - dy)
    right_child = (x + dx, y - dy)

    linestyle = ['-', '--', '-.', ':'][level]

    ax.plot([x, left_child[0]], [y, left_child[1]], linestyle=linestyle)
    ax.plot([x, right_child[0]], [y, right_child[1]], linestyle=linestyle)

    draw_tree(ax, left_child, left_child[0], left_child[1], dx/2, dy, level+1)
    draw_tree(ax, right_child, right_child[0], right_child[1], dx/2, dy, level+1)

fig, ax = plt.subplots(figsize=(10, 8))

draw_tree(ax, 'root', 0, 0, 1, 1)

ax.set_xlim(-2, 2)
ax.set_ylim(-4, 1)
ax.axis('off')
ax.set_title("Tree Diagram with Different Line Styles - how2matplotlib.com")

plt.show()

print("The tree diagram has been displayed.")
Output:
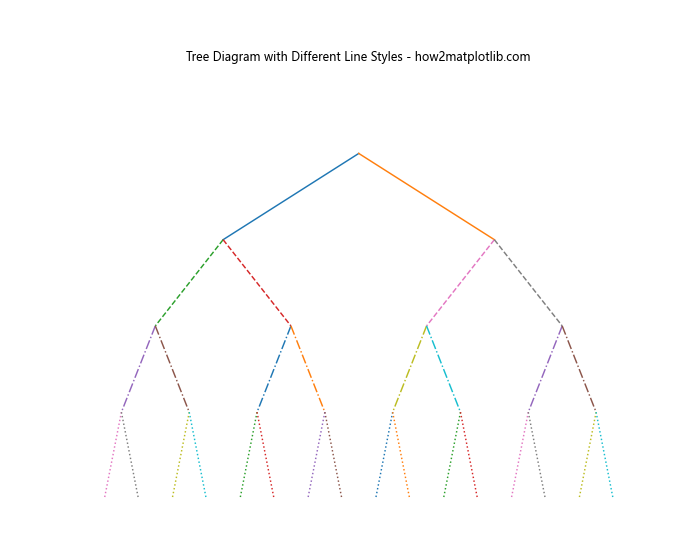
这个树状图示例展示了如何使用不同的线型来表示树的不同层级,使得结构更加清晰。
15. 线型在数据分析中的应用
在数据分析过程中,线型可以用来强调某些特定的数据特征或趋势。让我们看几个具体的应用例子。
15.1 趋势线和实际数据
在展示数据趋势时,我们可以使用不同的线型来区分实际数据和趋势线:
import matplotlib.pyplot as plt
import numpy as np
from scipy import stats

np.random.seed(0)
x = np.arange(0, 100)
y = 2 * x + 1 + np.random.normal(0, 10, 100)

slope, intercept, r_value, p_value, std_err = stats.linregress(x, y)
line = slope * x + intercept

plt.figure(figsize=(12, 6))
plt.plot(x, y, 'o', label='Data')
plt.plot(x, line, 'r--', label='Trend Line')

plt.title('Data with Trend Line - how2matplotlib.com')
plt.xlabel('X-axis')
plt.ylabel('Y-axis')
plt.legend()
plt.grid(True)
plt.show()

print("The plot with data and trend line has been displayed.")
Output:
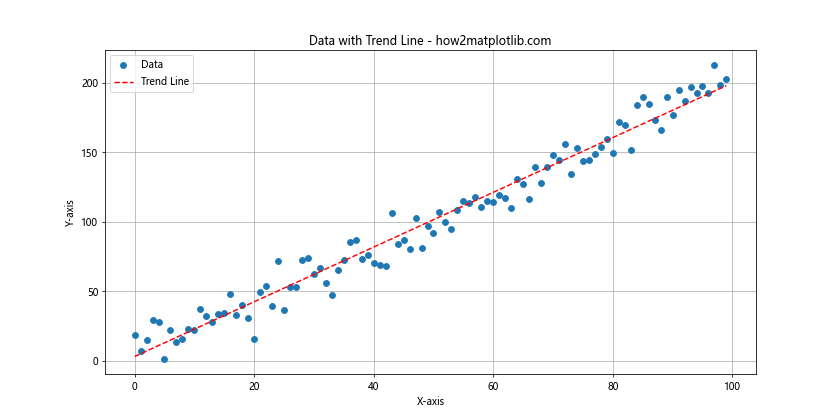
在这个例子中,我们使用散点表示实际数据,使用红色虚线表示趋势线。这种方法可以清晰地展示数据的整体趋势。
15.2 预测区间
在进行预测时,我们可以使用不同的线型来表示预测值和预测区间:
import matplotlib.pyplot as plt
import numpy as np
from scipy import stats

np.random.seed(0)
x = np.arange(0, 100)
y = 2 * x + 1 + np.random.normal(0, 10, 100)

slope, intercept, r_value, p_value, std_err = stats.linregress(x, y)
line = slope * x + intercept

plt.figure(figsize=(12, 6))
plt.plot(x, y, 'o', label='Data')
plt.plot(x, line, 'r-', label='Prediction')

# 计算预测区间
pi = 1.96 * np.std(y - line)
plt.fill_between(x, line - pi, line + pi, color='gray', alpha=0.2, label='95% Prediction Interval')
plt.plot(x, line - pi, 'r--', linewidth=0.5)
plt.plot(x, line + pi, 'r--', linewidth=0.5)

plt.title('Data with Prediction and Interval - how2matplotlib.com')
plt.xlabel('X-axis')
plt.ylabel('Y-axis')
plt.legend()
plt.grid(True)
plt.show()

print("The plot with prediction and interval has been displayed.")
Output:
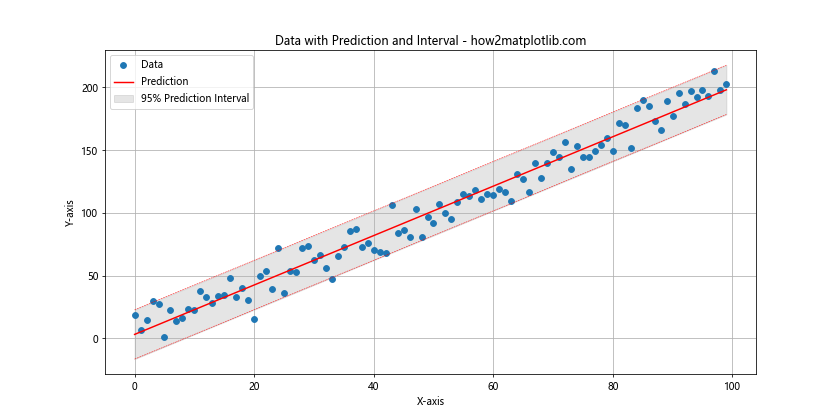
在这个例子中,我们使用实线表示预测值,虚线表示预测区间的边界,并用浅灰色填充区域表示预测区间。
15.3 异常值检测
在异常值检测中,我们可以使用不同的线型来突出显示异常值:
import matplotlib.pyplot as plt
import numpy as np

np.random.seed(0)
x = np.arange(0, 100)
y = 2 * x + 1 + np.random.normal(0, 5, 100)

# 添加一些异常值
outliers = np.random.choice(100, 5, replace=False)
y[outliers] += np.random.normal(0, 30, 5)

plt.figure(figsize=(12, 6))
plt.plot(x, y, 'b-', label='Normal Data')
plt.plot(x[outliers], y[outliers], 'ro', label='Outliers')

for i in outliers:
    plt.plot([x[i], x[i]], [2*x[i]+1, y[i]], 'r--')

plt.title('Data with Outliers - how2matplotlib.com')
plt.xlabel('X-axis')
plt.ylabel('Y-axis')
plt.legend()
plt.grid(True)
plt.show()

print("The plot with outliers has been displayed.")
Output:
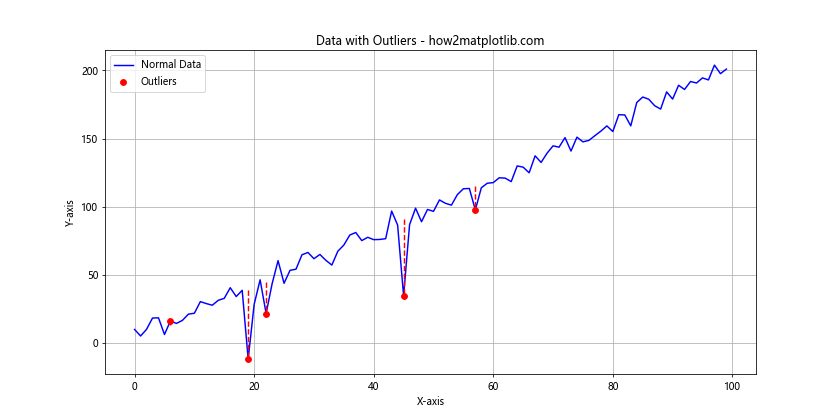
在这个例子中,我们使用蓝色实线表示正常数据,红色圆点表示异常值,红色虚线连接异常值和预期值,以突出显示异常的程度。
16. 线型在多子图中的应用
在创建包含多个子图的复杂图表时,合理使用线型可以帮助读者更好地理解和比较不同子图中的数据。
16.1 不同子图使用不同线型
我们可以在不同的子图中使用不同的线型来区分数据:
import matplotlib.pyplot as plt
import numpy as np

x = np.linspace(0, 10, 100)

fig, axs = plt.subplots(2, 2, figsize=(12, 10))
fig.suptitle('Multiple Subplots with Different Line Styles - how2matplotlib.com')

axs[0, 0].plot(x, np.sin(x), '-')
axs[0, 0].set_title('Sine Wave')

axs[0, 1].plot(x, np.cos(x), '--')
axs[0, 1].set_title('Cosine Wave')

axs[1, 0].plot(x, np.tan(x), '-.')
axs[1, 0].set_title('Tangent Wave')

axs[1, 1].plot(x, np.exp(x), ':')
axs[1, 1].set_title('Exponential Function')

for ax in axs.flat:
    ax.set(xlabel='x-axis', ylabel='y-axis')
    ax.grid(True)

plt.tight_layout()
plt.show()

print("The plot with multiple subplots has been displayed.")
Output:
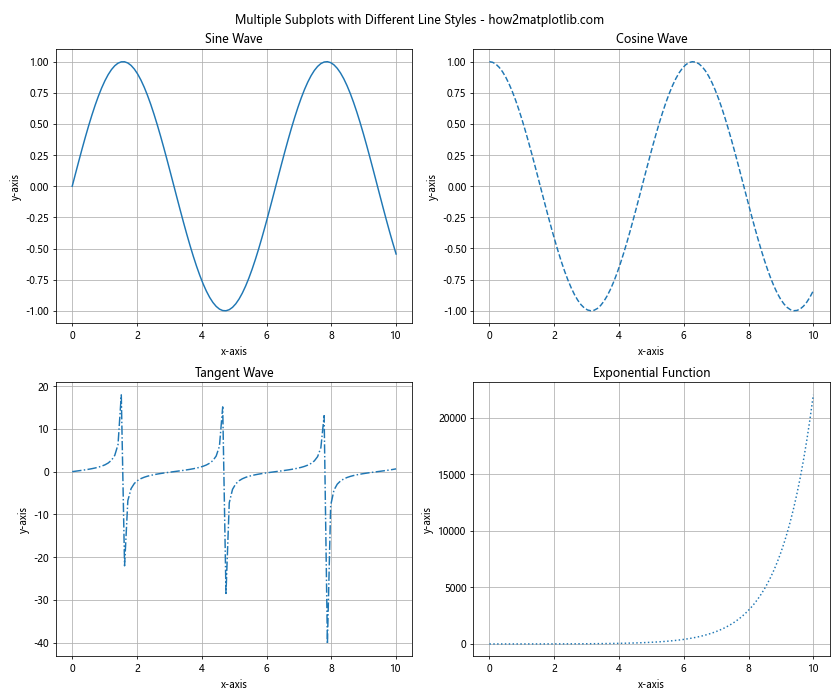
这个例子展示了如何在四个不同的子图中使用不同的线型来表示不同的数学函数。
16.2 在同一子图中比较不同线型
我们也可以在同一个子图中使用不同的线型来比较多个数据系列:
import matplotlib.pyplot as plt
import numpy as np

x = np.linspace(0, 10, 100)

fig, axs = plt.subplots(2, 2, figsize=(12, 10))
fig.suptitle('Comparing Different Functions - how2matplotlib.com')

axs[0, 0].plot(x, np.sin(x), '-', label='sin(x)')
axs[0, 0].plot(x, np.cos(x), '--', label='cos(x)')
axs[0, 0].set_title('Trigonometric Functions')
axs[0, 0].legend()

axs[0, 1].plot(x, x, '-', label='x')
axs[0, 1].plot(x, x**2, '--', label='x^2')
axs[0, 1].plot(x, x**3, '-.', label='x^3')
axs[0, 1].set_title('Polynomial Functions')
axs[0, 1].legend()

axs[1, 0].plot(x, np.exp(x), '-', label='exp(x)')
axs[1, 0].plot(x, np.log(x), '--', label='log(x)')
axs[1, 0].set_title('Exponential and Logarithmic Functions')
axs[1, 0].legend()

axs[1, 1].plot(x, np.sinh(x), '-', label='sinh(x)')
axs[1, 1].plot(x, np.cosh(x), '--', label='cosh(x)')
axs[1, 1].set_title('Hyperbolic Functions')
axs[1, 1].legend()

for ax in axs.flat:
    ax.set(xlabel='x-axis', ylabel='y-axis')
    ax.grid(True)

plt.tight_layout()
plt.show()

print("The plot comparing different functions has been displayed.")
这个例子展示了如何在每个子图中使用不同的线型来比较多个相关的数学函数。
17. 线型在交互式图表中的应用
虽然 Matplotlib 主要用于创建静态图表,但它也可以与一些交互式工具结合使用。在交互式图表中,线型可以用来增强用户体验。
17.1 使用 Slider 调整线型
我们可以创建一个交互式图表,允许用户通过滑块来调整线型:
import matplotlib.pyplot as plt
import numpy as np
from matplotlib.widgets import Slider

x = np.linspace(0, 10, 100)
y = np.sin(x)

fig, ax = plt.subplots(figsize=(10, 6))
line, = ax.plot(x, y, '-')

ax.set_xlabel('X-axis')
ax.set_ylabel('Y-axis')
ax.set_title('Interactive Line Style - how2matplotlib.com')

axcolor = 'lightgoldenrodyellow'
ax_slider = plt.axes([0.2, 0.02, 0.6, 0.03], facecolor=axcolor)

slider = Slider(ax_slider, 'Line Style', 0, 3, valinit=0, valstep=1)

def update(val):
    styles = ['-', '--', '-.', ':']
    line.set_linestyle(styles[int(val)])
    fig.canvas.draw_idle()

slider.on_changed(update)

plt.show()

print("The interactive plot has been displayed.")
Output:
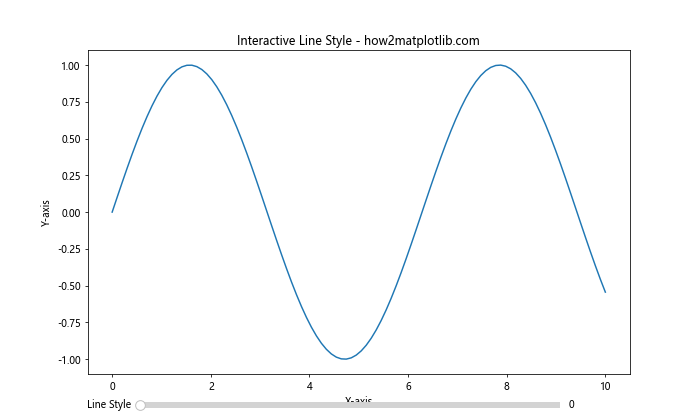
这个例子创建了一个交互式图表,用户可以通过滑块来切换不同的线型。
17.2 使用按钮切换线型
我们也可以使用按钮来切换不同的线型:
import matplotlib.pyplot as plt
import numpy as np
from matplotlib.widgets import Button

x = np.linspace(0, 10, 100)
y = np.sin(x)

fig, ax = plt.subplots(figsize=(10, 6))
line, = ax.plot(x, y, '-')

ax.set_xlabel('X-axis')
ax.set_ylabel('Y-axis')
ax.set_title('Interactive Line Style Selection - how2matplotlib.com')

styles = ['-', '--', '-.', ':']
current_style = 0

def next_style(event):
    global current_style
    current_style = (current_style + 1) % len(styles)
    line.set_linestyle(styles[current_style])
    fig.canvas.draw_idle()

ax_button = plt.axes([0.81, 0.05, 0.1, 0.075])
button = Button(ax_button, 'Next Style')
button.on_clicked(next_style)

plt.show()

print("The interactive plot with button has been displayed.")
Output:
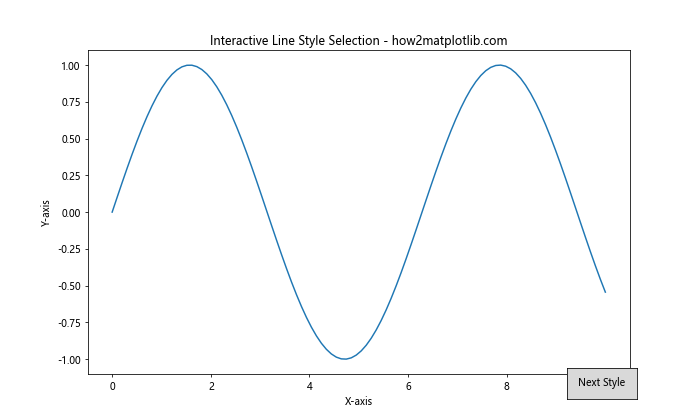
这个例子创建了一个交互式图表,用户可以通过点击按钮来循环切换不同的线型。
结论
通过本文的详细探讨,我们深入了解了 Matplotlib 中线型选项的丰富性和灵活性。从基本的预定义线型到复杂的自定义线型,从静态图表到动态动画,从简单的 2D 图形到复杂的 3D 可视化,线型在数据可视化中扮演着至关重要的角色。
合理使用线型可以大大提高图表的可读性和信息传递效率。它可以帮助我们区分不同的数据系列,突出重要的趋势,表示数据的不确定性,甚至可以用来编码额外的信息维度。
在实际应用中,选择合适的线型需要考虑多个因素,包括数据的性质、图表的目的、目标受众等。同时,我们也要注意不要过度使用不同的线型,以免造成视觉混乱。
最后,随着数据可视化技术的不断发展,线型的应用也在不断拓展。结合交互式技术、动画效果等,我们可以创造出更加丰富和有吸引力的数据可视化作品。掌握 Matplotlib 的线型选项,将为您的数据可视化工作带来无限可能。
 极客教程
极客教程