Matplotlib图例标题
在matplotlib中,图例是用来标识不同数据系列或者图表元素的重要工具。通常情况下,图例会显示在图表的右上角或者左上角,用来说明不同颜色或者线条代表的含义。而有时候,我们也可以给图例添加标题,来更清晰地说明代表的内容。本文将介绍如何在matplotlib中给图例添加标题。
示例1:基本的图例显示
import matplotlib.pyplot as plt

x = [1, 2, 3, 4, 5]
y1 = [2, 3, 5, 7, 6]
y2 = [1, 4, 6, 8, 7]

plt.plot(x, y1, label='Line 1')
plt.plot(x, y2, label='Line 2')
plt.legend()
plt.show()
Output:
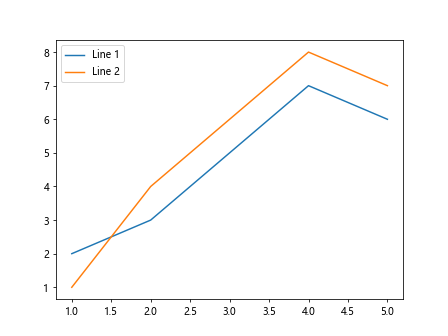
在上面的示例中,我们绘制了两条线,并使用plt.legend()函数显示了图例。但是这个图例并没有标题来说明代表的含义,接下来我们将介绍如何给图例添加标题。
示例2:添加图例标题
import matplotlib.pyplot as plt

x = [1, 2, 3, 4, 5]
y1 = [2, 3, 5, 7, 6]
y2 = [1, 4, 6, 8, 7]

plt.plot(x, y1, label='Line 1')
plt.plot(x, y2, label='Line 2')
plt.legend(title='Legend Title')
plt.show()
Output:
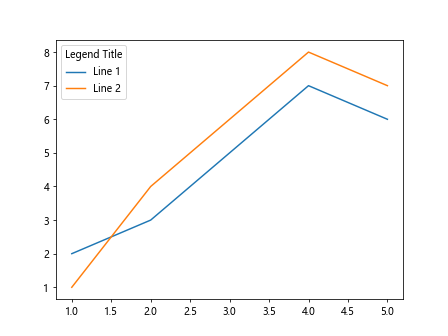
通过在plt.legend()函数中添加title='Legend Title'参数,我们就可以给图例添加标题了。
示例3:设置图例标题的字体大小和样式
import matplotlib.pyplot as plt
import matplotlib.font_manager as fm

prop = fm.FontProperties(fname='Arial', size=12, weight='bold', style='italic')

x = [1, 2, 3, 4, 5]
y1 = [2, 3, 5, 7, 6]
y2 = [1, 4, 6, 8, 7]

plt.plot(x, y1, label='Line 1')
plt.plot(x, y2, label='Line 2')
plt.legend(title='Legend Title', prop=prop)
plt.show()
在上面的示例中,我们使用FontProperties类来设置图例标题的字体大小、粗细和样式。
示例4:将图例标题放在图例的下方
import matplotlib.pyplot as plt

x = [1, 2, 3, 4, 5]
y1 = [2, 3, 5, 7, 6]
y2 = [1, 4, 6, 8, 7]

plt.plot(x, y1, label='Line 1')
plt.plot(x, y2, label='Line 2')
plt.legend(title='Legend Title', title_position='bottom')
plt.show()
通过在plt.legend()函数中添加title_position='bottom'参数,我们可以将图例标题放在图例的下方。
示例5:设置图例标题的位置
import matplotlib.pyplot as plt

x = [1, 2, 3, 4, 5]
y1 = [2, 3, 5, 7, 6]
y2 = [1, 4, 6, 8, 7]

plt.plot(x, y1, label='Line 1')
plt.plot(x, y2, label='Line 2')
plt.legend(title='Legend Title', loc='upper left')
plt.show()
Output:
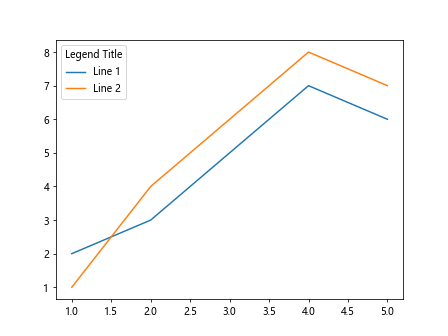
在上面的示例中,我们通过设置loc='upper left'将图例标题放在左上角位置。loc参数可以设置为各种不同的位置,比如’upper right’、’lower right’等等。
示例6:设置图例标题的背景颜色
import matplotlib.pyplot as plt

x = [1, 2, 3, 4, 5]
y1 = [2, 3, 5, 7, 6]
y2 = [1, 4, 6, 8, 7]

plt.plot(x, y1, label='Line 1')
plt.plot(x, y2, label='Line 2')
plt.legend(title='Legend Title', facecolor='lightpink')
plt.show()
Output:
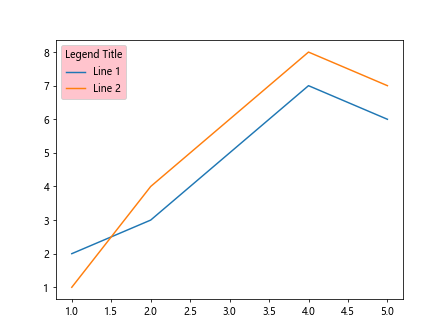
通过在plt.legend()函数中添加facecolor='lightpink'参数,我们可以设置图例标题的背景颜色。
示例7:设置图例标题的边框
import matplotlib.pyplot as plt

x = [1, 2, 3, 4, 5]
y1 = [2, 3, 5, 7, 6]
y2 = [1, 4, 6, 8, 7]

plt.plot(x, y1, label='Line 1')
plt.plot(x, y2, label='Line 2')
plt.legend(title='Legend Title', shadow=True, borderpad=1)
plt.show()
Output:
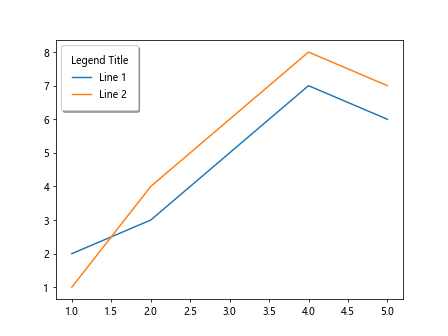
通过在plt.legend()函数中添加shadow=True和borderpad=1参数,我们可以给图例标题添加阴影和边框。
示例8:设置图例标题的透明度
import matplotlib.pyplot as plt

x = [1, 2, 3, 4, 5]
y1 = [2, 3, 5, 7, 6]
y2 = [1, 4, 6, 8, 7]

plt.plot(x, y1, label='Line 1')
plt.plot(x, y2, label='Line 2')
plt.legend(title='Legend Title', alpha=0.5)
plt.show()
通过在plt.legend()函数中添加alpha=0.5参数,我们可以设置图例标题的透明度。
示例9:使用HTML标签来设置图例标题的样式
import matplotlib.pyplot as plt

x = [1, 2, 3, 4, 5]
y1 = [2, 3, 5, 7, 6]
y2 = [1, 4, 6, 8, 7]

plt.plot(x, y1, label='Line 1')
plt.plot(x, y2, label='Line 2')
plt.legend(title='<i><b>Legend</b></i> <font color="red">Title</font>', title_fontsize='large')
plt.show()
Output:
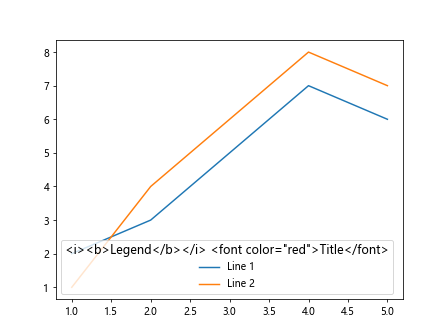
通过在plt.legend()函数中使用HTML标签来设置图例标题的样式,比如加粗、斜体、颜色等。
示例10:将图例标题旋转45度
import matplotlib.pyplot as plt

x = [1, 2, 3, 4, 5]
y1 = [2, 3, 5, 7, 6]
y2 = [1, 4, 6, 8, 7]

plt.plot(x, y1, label='Line 1')
plt.plot(x, y2, label='Line 2')
plt.legend(title='Legend Title', title_rotation=45)
plt.show()
通过在plt.legend()函数中添加title_rotation=45参数,我们可以将图例标题旋转45度显示。
总的来说,在matplotlib中给图例添加标题是一个很方便的功能,可以帮助我们更清晰地说明图表中的不同元素之间的关系。
 极客教程
极客教程