Matplotlib 图形尺寸设置:像素精确控制
参考:matplotlib figure size in pixels
Matplotlib 是 Python 中最流行的数据可视化库之一,它提供了强大而灵活的工具来创建各种类型的图表和绘图。在使用 Matplotlib 时,控制图形的尺寸是一个重要的方面,特别是当我们需要精确控制输出图像的像素大小时。本文将深入探讨如何在 Matplotlib 中设置和调整图形尺寸,以像素为单位进行精确控制。
1. 基本概念
在开始之前,我们需要了解一些基本概念:
- Figure:整个图形窗口
- Axes:图形中的坐标系
- DPI(Dots Per Inch):每英寸点数,用于定义图像的分辨率
在 Matplotlib 中,图形的实际尺寸是由 Figure 的大小(以英寸为单位)和 DPI 共同决定的。
像素尺寸 = Figure 尺寸(英寸) * DPI
例如,如果我们创建一个 6×4 英寸的 Figure,并将 DPI 设置为 100,那么最终的图像尺寸将是 600×400 像素。
让我们从一个基本的例子开始:
import matplotlib.pyplot as plt

# 创建一个 6x4 英寸的图形,DPI 为 100
fig, ax = plt.subplots(figsize=(6, 4), dpi=100)

# 绘制一些数据
ax.plot([1, 2, 3, 4], [1, 4, 2, 3], label='how2matplotlib.com')
ax.set_title('Basic Figure Size Example')
ax.legend()

plt.show()
Output:
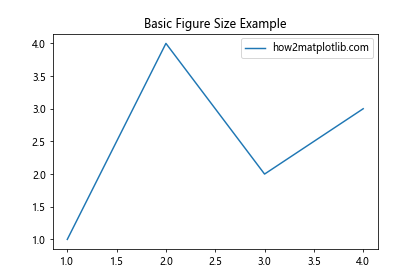
在这个例子中,我们创建了一个 6×4 英寸的图形,DPI 设置为 100。这将产生一个 600×400 像素的图像。figsize 参数用于设置图形的尺寸(以英寸为单位),而 dpi 参数设置每英寸的点数。
2. 精确控制像素尺寸
如果我们想要创建一个精确像素尺寸的图形,我们需要反向计算 figsize 参数。这里有一个函数可以帮助我们实现这一点:
import matplotlib.pyplot as plt

def set_size(w, h, dpi=100):
    return (w/dpi, h/dpi)

# 创建一个 800x600 像素的图形
fig, ax = plt.subplots(figsize=set_size(800, 600))

# 绘制数据
ax.plot([1, 2, 3, 4], [1, 4, 2, 3], label='how2matplotlib.com')
ax.set_title('Precise Pixel Size Example')
ax.legend()

plt.show()
Output:
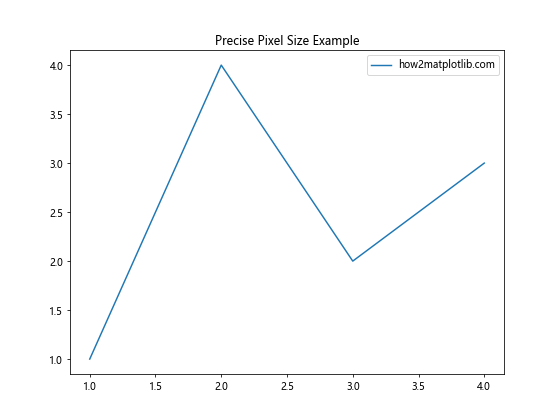
在这个例子中,set_size 函数接受所需的宽度和高度(以像素为单位)以及 DPI(默认为 100),然后返回适当的 figsize 值。这样,我们就可以精确控制图形的像素尺寸。
3. 调整现有图形的尺寸
有时,我们可能需要在创建图形后调整其尺寸。Matplotlib 提供了 Figure.set_size_inches() 方法来实现这一点:
import matplotlib.pyplot as plt

fig, ax = plt.subplots()

# 绘制数据
ax.plot([1, 2, 3, 4], [1, 4, 2, 3], label='how2matplotlib.com')
ax.set_title('Resized Figure Example')
ax.legend()

# 调整图形尺寸为 10x6 英寸
fig.set_size_inches(10, 6)

plt.show()
Output:
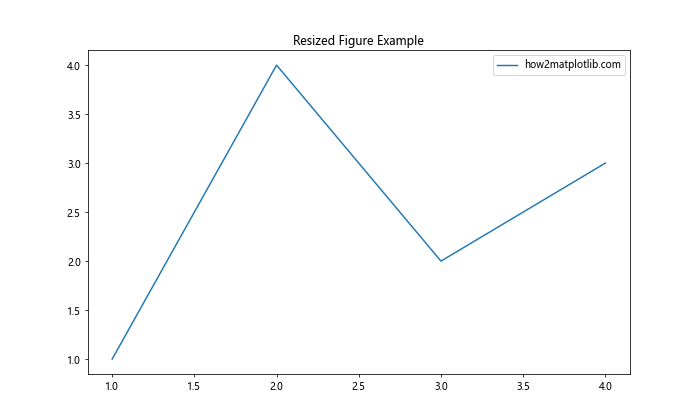
这个方法允许我们在绘图完成后更改图形的尺寸。注意,这不会自动调整 DPI,所以如果你想保持特定的像素尺寸,你可能还需要调整 DPI。
4. 设置默认图形尺寸
如果你发现自己经常使用相同的图形尺寸,你可以设置 Matplotlib 的默认值:
import matplotlib.pyplot as plt

# 设置默认图形尺寸
plt.rcParams['figure.figsize'] = [8.0, 6.0]
plt.rcParams['figure.dpi'] = 100

# 创建一个使用默认设置的图形
fig, ax = plt.subplots()

ax.plot([1, 2, 3, 4], [1, 4, 2, 3], label='how2matplotlib.com')
ax.set_title('Default Figure Size Example')
ax.legend()

plt.show()
Output:
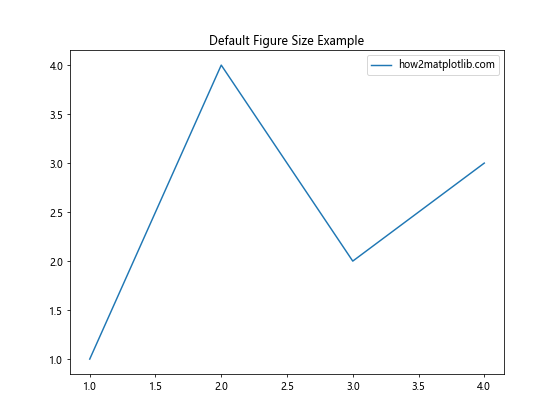
这段代码设置了默认的图形尺寸为 8×6 英寸,DPI 为 100。这意味着除非另有指定,所有新创建的图形都将使用这些设置。
5. 保存特定像素尺寸的图形
当保存图形时,我们可能想要确保输出文件具有特定的像素尺寸。这可以通过 savefig() 函数实现:
import matplotlib.pyplot as plt

fig, ax = plt.subplots(figsize=(8, 6))

ax.plot([1, 2, 3, 4], [1, 4, 2, 3], label='how2matplotlib.com')
ax.set_title('Saved Figure with Specific Pixel Size')
ax.legend()

# 保存为 1600x1200 像素的图像
fig.savefig('how2matplotlib_example.png', dpi=200)
在这个例子中,我们创建了一个 8×6 英寸的图形,然后以 200 DPI 保存它,resulting in a 1600×1200 像素的图像。
6. 处理不同的屏幕分辨率
在不同的显示设备上,相同的英寸尺寸可能会显示为不同的像素尺寸。为了处理这种情况,我们可以使用 plt.figure() 函数的 dpi 参数:
import matplotlib.pyplot as plt

# 创建一个图形,考虑到高分辨率显示器
plt.figure(figsize=(8, 6), dpi=200)

plt.plot([1, 2, 3, 4], [1, 4, 2, 3], label='how2matplotlib.com')
plt.title('High DPI Figure Example')
plt.legend()

plt.show()
Output:
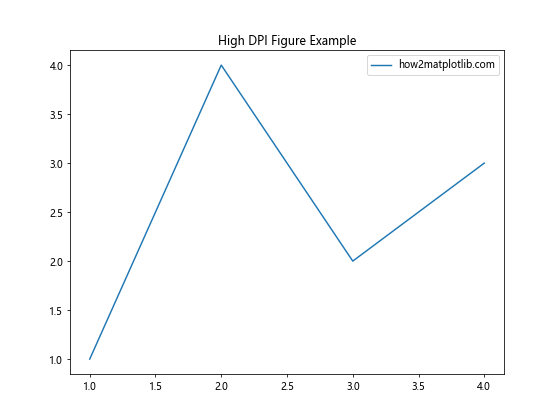
这个例子创建了一个在高分辨率显示器上看起来更清晰的图形。
7. 使用英寸和厘米
Matplotlib 默认使用英寸作为单位,但有时我们可能更习惯使用厘米。这里有一个简单的转换函数:
import matplotlib.pyplot as plt

def cm_to_inch(value):
    return value/2.54

# 创建一个 20x15 厘米的图形
fig, ax = plt.subplots(figsize=(cm_to_inch(20), cm_to_inch(15)))

ax.plot([1, 2, 3, 4], [1, 4, 2, 3], label='how2matplotlib.com')
ax.set_title('Figure Size in Centimeters')
ax.legend()

plt.show()
Output:
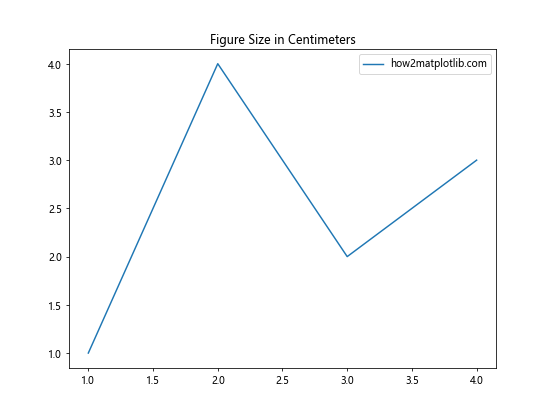
这个函数将厘米转换为英寸,使我们可以更容易地使用熟悉的度量单位。
8. 调整子图布局
当我们有多个子图时,控制整体图形尺寸和各个子图的尺寸变得更加重要:
import matplotlib.pyplot as plt

fig, (ax1, ax2) = plt.subplots(1, 2, figsize=(12, 5))

ax1.plot([1, 2, 3, 4], [1, 4, 2, 3], label='how2matplotlib.com')
ax1.set_title('Subplot 1')
ax1.legend()

ax2.scatter([1, 2, 3, 4], [3, 1, 4, 2], label='how2matplotlib.com')
ax2.set_title('Subplot 2')
ax2.legend()

plt.tight_layout()  # 自动调整子图布局
plt.show()
Output:
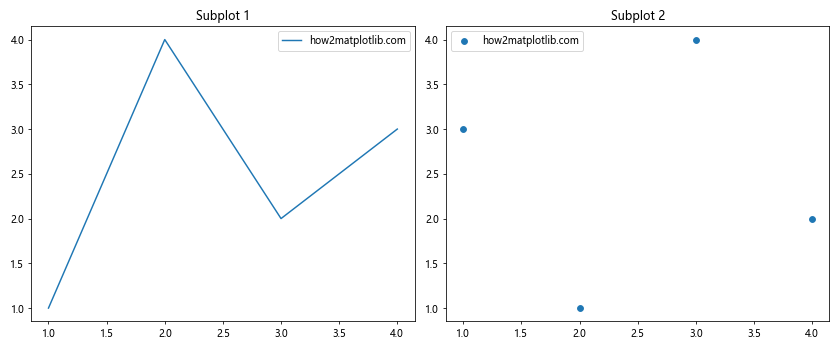
在这个例子中,我们创建了一个包含两个子图的图形。tight_layout() 函数用于自动调整子图之间的间距,确保标签和标题不会重叠。
9. 使用 constrained_layout
constrained_layout 是 Matplotlib 提供的另一种自动调整布局的方法,它通常比 tight_layout 效果更好:
import matplotlib.pyplot as plt

fig, (ax1, ax2) = plt.subplots(1, 2, figsize=(12, 5), constrained_layout=True)

ax1.plot([1, 2, 3, 4], [1, 4, 2, 3], label='how2matplotlib.com')
ax1.set_title('Subplot 1 with Constrained Layout')
ax1.legend()

ax2.scatter([1, 2, 3, 4], [3, 1, 4, 2], label='how2matplotlib.com')
ax2.set_title('Subplot 2 with Constrained Layout')
ax2.legend()

plt.show()
Output:
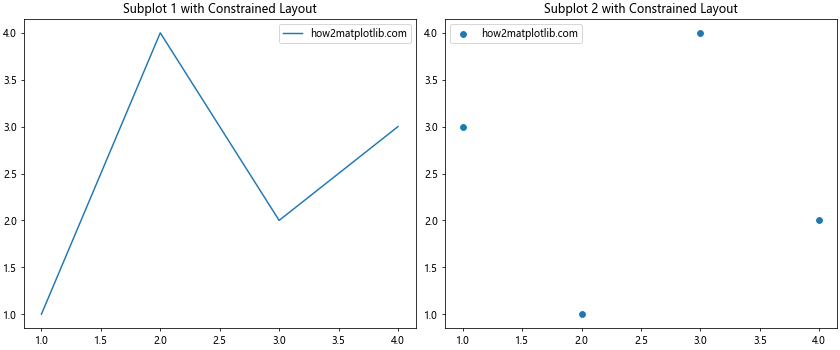
constrained_layout=True 参数会自动调整子图的大小和位置,以确保所有元素都能正确显示,而不会重叠或被截断。
10. 动态调整图形尺寸
有时,我们可能需要根据数据或其他条件动态调整图形尺寸。这里有一个例子展示如何根据数据点的数量来调整图形宽度:
import matplotlib.pyplot as plt
import numpy as np

def dynamic_figure_size(data_length, height=6, width_per_point=0.05):
    return (max(6, data_length * width_per_point), height)

x = np.linspace(0, 10, 50)
y = np.sin(x)

fig, ax = plt.subplots(figsize=dynamic_figure_size(len(x)))

ax.plot(x, y, label='how2matplotlib.com')
ax.set_title('Dynamic Figure Size Example')
ax.legend()

plt.show()
Output:
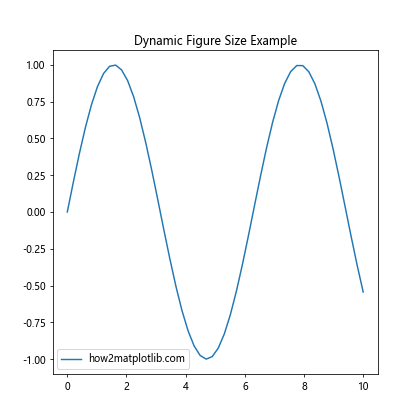
在这个例子中,dynamic_figure_size 函数根据数据点的数量计算适当的图形宽度,确保图形不会太窄或太宽。
11. 处理长标签和标题
当处理长标签或标题时,可能需要额外的空间来确保它们完全显示:
import matplotlib.pyplot as plt

fig, ax = plt.subplots(figsize=(8, 6))

ax.plot([1, 2, 3, 4], [1, 4, 2, 3], label='how2matplotlib.com - Long Label Example')
ax.set_title('This is a Very Long Title That Might Need Extra Space')
ax.set_xlabel('This is a Long X-axis Label')
ax.set_ylabel('This is a Long Y-axis Label')
ax.legend()

plt.tight_layout(pad=2.0)  # 增加内边距
plt.show()
Output:
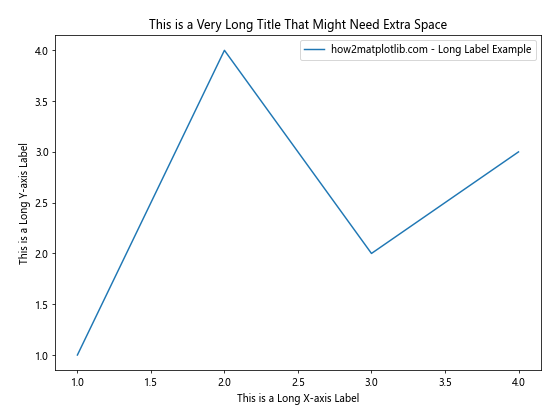
在这个例子中,我们使用 tight_layout(pad=2.0) 来增加图形周围的内边距,为长标签和标题提供更多空间。
12. 创建固定宽高比的图形
有时,我们可能想要创建具有特定宽高比的图形,无论整体尺寸如何:
import matplotlib.pyplot as plt

def set_size_with_aspect(w, h, aspect_ratio=16/9, dpi=100):
    if w / h > aspect_ratio:
        w = h * aspect_ratio
    else:
        h = w / aspect_ratio
    return (w/dpi, h/dpi)

fig, ax = plt.subplots(figsize=set_size_with_aspect(800, 600))

ax.plot([1, 2, 3, 4], [1, 4, 2, 3], label='how2matplotlib.com')
ax.set_title('Fixed Aspect Ratio Figure')
ax.legend()

plt.show()
Output:
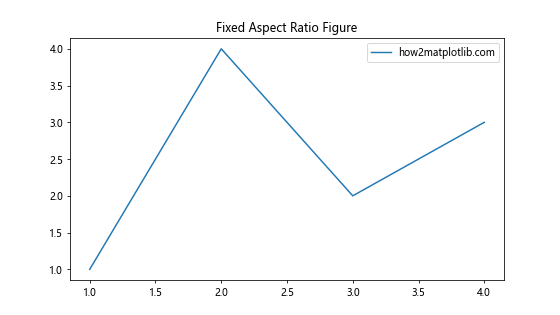
这个例子定义了一个函数,它可以创建具有固定宽高比(在这里是 16:9)的图形,同时尽可能接近指定的像素尺寸。
13. 使用 GridSpec 进行复杂布局
对于更复杂的布局,我们可以使用 GridSpec:
import matplotlib.pyplot as plt
import matplotlib.gridspec as gridspec

fig = plt.figure(figsize=(12, 8))
gs = gridspec.GridSpec(2, 2, width_ratios=[2, 1], height_ratios=[1, 2])

ax1 = fig.add_subplot(gs[0, 0])
ax2 = fig.add_subplot(gs[0, 1])
ax3 = fig.add_subplot(gs[1, :])

ax1.plot([1, 2, 3], [4, 5, 6], label='how2matplotlib.com')
ax1.set_title('Subplot 1')
ax1.legend()

ax2.scatter([1, 2, 3], [4, 5, 6], label='how2matplotlib.com')
ax2.set_title('Subplot 2')
ax2.legend()

ax3.bar([1, 2, 3], [4, 5, 6], label='how2matplotlib.com')
ax3.set_title('Subplot 3')
ax3.legend()

plt.tight_layout()
plt.show()
Output:
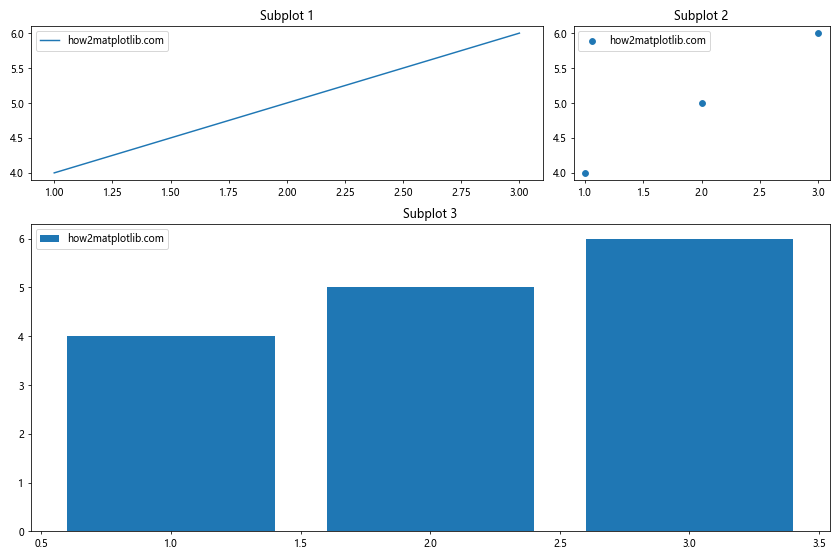
这个例子使用 GridSpec 创建了一个复杂的布局,其中顶部有两个不同大小的子图,底部有一个跨越整个宽度的子图。
14. 调整图形边界
有时我们可能需要精确控制图形的边界:
import matplotlib.pyplot as plt

fig, ax = plt.subplots(figsize=(8, 6))

ax.plot([1,2, 3, 4], [1, 4, 2, 3], label='how2matplotlib.com')
ax.set_title('Adjusted Figure Margins')
ax.legend()

# 调整图形边界
plt.subplots_adjust(left=0.15, right=0.95, top=0.9, bottom=0.1)

plt.show()
Output:
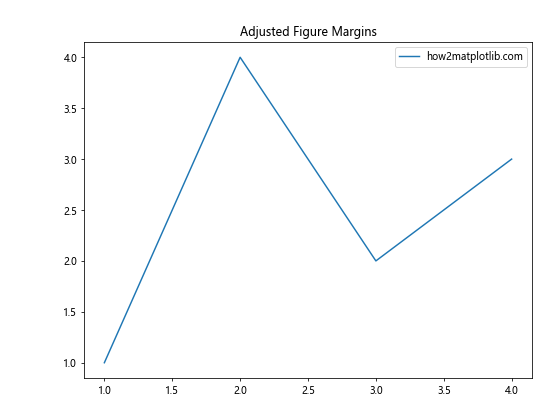
在这个例子中,我们使用 plt.subplots_adjust() 来精确控制图形的边界。这对于确保有足够的空间显示标签和标题非常有用。
15. 创建不同尺寸的子图
在某些情况下,我们可能需要创建具有不同尺寸的子图:
import matplotlib.pyplot as plt

fig = plt.figure(figsize=(12, 8))

# 创建一个大的主图
ax1 = plt.subplot2grid((3, 3), (0, 0), colspan=2, rowspan=2)
ax1.plot([1, 2, 3, 4], [1, 4, 2, 3], label='how2matplotlib.com')
ax1.set_title('Main Plot')
ax1.legend()

# 创建两个较小的子图
ax2 = plt.subplot2grid((3, 3), (0, 2), rowspan=1)
ax2.scatter([1, 2, 3], [1, 2, 3], label='how2matplotlib.com')
ax2.set_title('Subplot 1')
ax2.legend()

ax3 = plt.subplot2grid((3, 3), (1, 2), rowspan=1)
ax3.bar([1, 2, 3], [1, 2, 3], label='how2matplotlib.com')
ax3.set_title('Subplot 2')
ax3.legend()

# 创建一个跨越底部的子图
ax4 = plt.subplot2grid((3, 3), (2, 0), colspan=3)
ax4.plot([1, 2, 3, 4], [4, 3, 2, 1], label='how2matplotlib.com')
ax4.set_title('Bottom Plot')
ax4.legend()

plt.tight_layout()
plt.show()
Output:
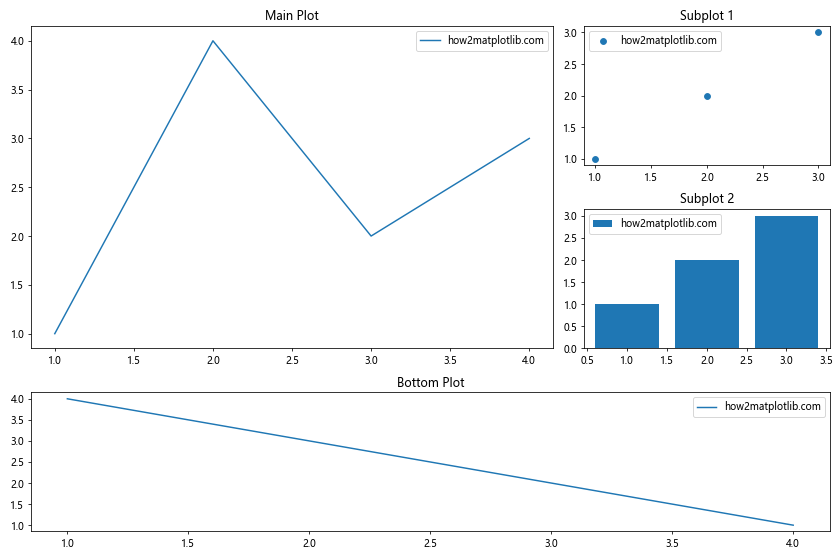
这个例子使用 subplot2grid 创建了一个复杂的布局,包含不同大小的子图。
16. 使用英寸和像素混合设置图形尺寸
有时我们可能需要混合使用英寸和像素来设置图形尺寸:
import matplotlib.pyplot as plt

def mixed_size(w_pixels, h_inches, dpi=100):
    return (w_pixels / dpi, h_inches)

fig, ax = plt.subplots(figsize=mixed_size(800, 6))

ax.plot([1, 2, 3, 4], [1, 4, 2, 3], label='how2matplotlib.com')
ax.set_title('Mixed Units Figure Size')
ax.legend()

plt.show()
Output:
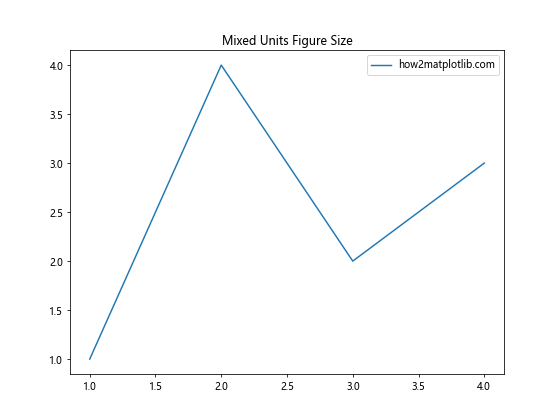
这个例子定义了一个函数,允许我们用像素指定宽度,用英寸指定高度。
17. 根据内容自动调整图形尺寸
在某些情况下,我们可能希望根据图形内容自动调整图形尺寸:
import matplotlib.pyplot as plt

fig, ax = plt.subplots()

ax.plot([1, 2, 3, 4], [1, 4, 2, 3], label='how2matplotlib.com')
ax.set_title('Auto-adjusted Figure Size')
ax.legend()

# 自动调整布局
plt.tight_layout()

# 获取当前图形的边界框
bbox = fig.get_tightbbox(fig.canvas.get_renderer())

# 根据边界框调整图形尺寸
fig.set_size_inches(bbox.width / fig.dpi, bbox.height / fig.dpi)

plt.show()
Output:

这个例子首先创建图形,然后使用 get_tightbbox 获取图形的紧凑边界框,最后根据这个边界框调整图形尺寸。
18. 创建固定像素尺寸的图形
如果我们需要创建一个精确像素尺寸的图形,可以使用以下方法:
import matplotlib.pyplot as plt

def fixed_size_in_pixels(w, h, dpi=100):
    return (w / dpi, h / dpi)

fig, ax = plt.subplots(figsize=fixed_size_in_pixels(640, 480), dpi=100)

ax.plot([1, 2, 3, 4], [1, 4, 2, 3], label='how2matplotlib.com')
ax.set_title('Fixed Pixel Size Figure')
ax.legend()

plt.show()
Output:
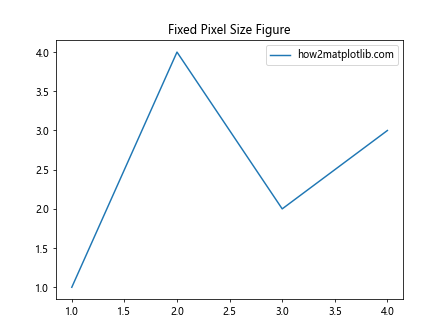
这个例子创建了一个精确为 640×480 像素的图形。
19. 处理高 DPI 显示器
对于高 DPI 显示器,我们可能需要增加图形的 DPI 以获得更清晰的显示效果:
import matplotlib.pyplot as plt

plt.rcParams['figure.dpi'] = 200  # 设置更高的 DPI

fig, ax = plt.subplots(figsize=(8, 6))

ax.plot([1, 2, 3, 4], [1, 4, 2, 3], label='how2matplotlib.com')
ax.set_title('High DPI Figure')
ax.legend()

plt.show()
Output:
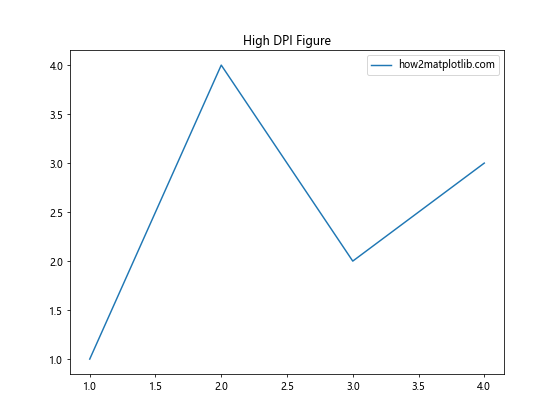
这个例子将默认 DPI 设置为 200,这将使图形在高 DPI 显示器上看起来更清晰。
20. 使用物理单位
Matplotlib 还支持使用物理单位来指定图形尺寸:
import matplotlib.pyplot as plt

fig, ax = plt.subplots(figsize=(20/2.54, 15/2.54))  # 20x15 厘米

ax.plot([1, 2, 3, 4], [1, 4, 2, 3], label='how2matplotlib.com')
ax.set_title('Figure Size in Centimeters')
ax.legend()

plt.show()
Output:
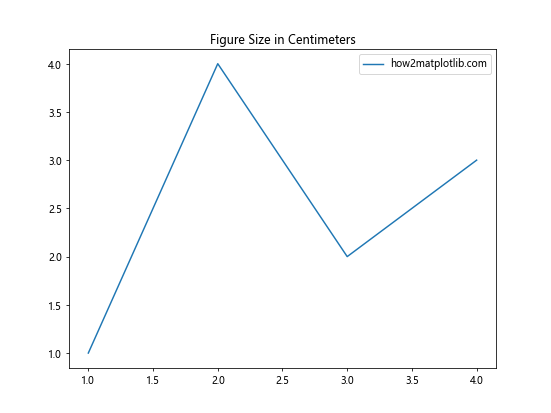
在这个例子中,我们直接使用厘米作为单位来指定图形尺寸。
总结:
本文详细探讨了如何在 Matplotlib 中精确控制图形尺寸,包括使用像素、英寸、厘米等不同单位,以及如何处理 DPI 设置、子图布局、高分辨率显示等问题。我们还介绍了一些高级技巧,如动态调整图形尺寸、创建固定宽高比的图形、使用 GridSpec 进行复杂布局等。
通过掌握这些技巧,你可以更好地控制 Matplotlib 图形的外观和尺寸,创建出精确符合你需求的数据可视化作品。记住,图形的清晰度和可读性对于有效传达信息至关重要,因此在设置图形尺寸时要考虑到最终的展示方式和目标受众。
无论是为了学术论文、报告、网页还是演示文稿,合适的图形尺寸都能让你的数据可视化更加专业和有说服力。希望这篇文章能帮助你更好地掌控 Matplotlib 中的图形尺寸设置,创作出更优秀的数据可视化作品。
 极客教程
极客教程