Matplotlib中使用Figure.set_facecolor()设置图形背景色的详细指南
参考:Matplotlib.figure.Figure.set_facecolor() in Python
Matplotlib是Python中最流行的数据可视化库之一,它提供了丰富的绘图功能和自定义选项。在创建图形时,设置适当的背景色可以大大提升图表的视觉效果和可读性。本文将深入探讨Matplotlib中Figure.set_facecolor()方法的使用,这是一个用于设置图形背景色的重要函数。
1. Figure.set_facecolor()方法简介
Figure.set_facecolor()是Matplotlib库中Figure类的一个方法,用于设置整个图形(Figure)的背景颜色。这个方法可以接受各种格式的颜色参数,包括颜色名称字符串、RGB元组、十六进制颜色代码等。
基本语法
fig.set_facecolor(color)
其中,fig是一个Figure对象,color是你想要设置的背景颜色。
简单示例
让我们从一个基本的例子开始,展示如何使用set_facecolor()方法:
import matplotlib.pyplot as plt

# 创建一个新的Figure对象
fig = plt.figure(figsize=(8, 6))

# 设置Figure的背景色为浅蓝色
fig.set_facecolor('lightblue')

# 添加一个子图
ax = fig.add_subplot(111)
ax.plot([1, 2, 3, 4], [1, 4, 2, 3], label='Data from how2matplotlib.com')
ax.set_title('Simple Plot with Light Blue Background')
ax.legend()

plt.show()
Output:
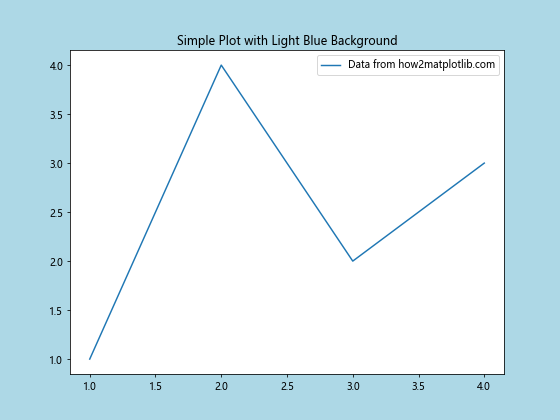
在这个例子中,我们创建了一个新的Figure对象,并使用set_facecolor()方法将其背景色设置为浅蓝色。然后,我们添加了一个简单的线图来展示效果。
2. 颜色参数的多种形式
set_facecolor()方法可以接受多种形式的颜色参数,这为用户提供了极大的灵活性。以下是几种常见的颜色指定方式:
2.1 使用颜色名称字符串
Matplotlib支持大量预定义的颜色名称,如’red’、’green’、’blue’等。
import matplotlib.pyplot as plt

fig = plt.figure(figsize=(8, 6))
fig.set_facecolor('salmon')

ax = fig.add_subplot(111)
ax.plot([1, 2, 3, 4], [1, 4, 2, 3], color='white')
ax.set_title('Plot with Salmon Background - how2matplotlib.com')

plt.show()
Output:

在这个例子中,我们使用’salmon’(鲑鱼色)作为背景色,这是一种预定义的颜色名称。
2.2 使用RGB元组
你可以使用RGB(红、绿、蓝)值的元组来精确指定颜色。每个值的范围是0到1。
import matplotlib.pyplot as plt

fig = plt.figure(figsize=(8, 6))
fig.set_facecolor((0.9, 0.9, 0.8))  # 淡黄色

ax = fig.add_subplot(111)
ax.scatter([1, 2, 3, 4], [1, 4, 2, 3], color='blue')
ax.set_title('Scatter Plot with Custom RGB Background - how2matplotlib.com')

plt.show()
Output:
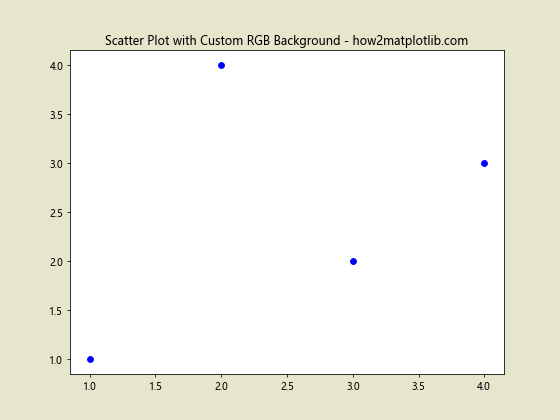
这里,我们使用RGB值(0.9, 0.9, 0.8)来创建一个淡黄色背景。
2.3 使用十六进制颜色代码
十六进制颜色代码是另一种常用的颜色指定方式。
import matplotlib.pyplot as plt

fig = plt.figure(figsize=(8, 6))
fig.set_facecolor('#E6E6FA')  # 淡紫色

ax = fig.add_subplot(111)
ax.bar([1, 2, 3, 4], [1, 4, 2, 3], color='darkblue')
ax.set_title('Bar Plot with Hex Color Background - how2matplotlib.com')

plt.show()
Output:
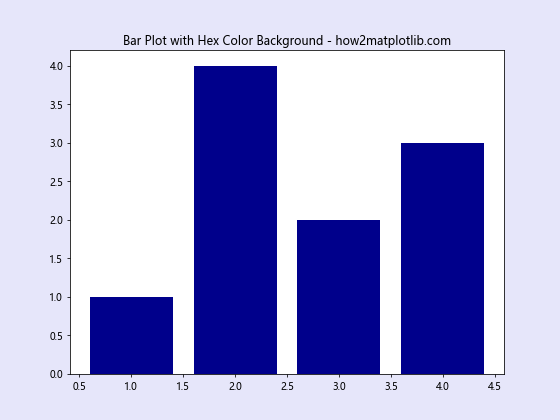
在这个例子中,我们使用十六进制颜色代码’#E6E6FA’来设置一个淡紫色背景。
3. 透明度设置
set_facecolor()方法还支持设置颜色的透明度。这可以通过在颜色参数中添加alpha值来实现。
3.1 使用RGBA值
RGBA值是RGB值加上一个alpha通道值,用于控制透明度。Alpha值的范围是0(完全透明)到1(完全不透明)。
import matplotlib.pyplot as plt

fig = plt.figure(figsize=(8, 6))
fig.set_facecolor((1, 0, 0, 0.1))  # 淡红色,10%不透明度

ax = fig.add_subplot(111)
ax.plot([1, 2, 3, 4], [1, 4, 2, 3], color='black')
ax.set_title('Plot with Semi-Transparent Background - how2matplotlib.com')

plt.show()
Output:

这个例子展示了如何使用RGBA值来设置一个半透明的红色背景。
3.2 使用颜色名称和alpha参数
你也可以分别指定颜色和透明度。
import matplotlib.pyplot as plt

fig = plt.figure(figsize=(8, 6))
fig.set_facecolor('green')
fig.patch.set_alpha(0.2)  # 设置20%的不透明度

ax = fig.add_subplot(111)
ax.plot([1, 2, 3, 4], [1, 4, 2, 3], color='red')
ax.set_title('Plot with Semi-Transparent Green Background - how2matplotlib.com')

plt.show()
Output:
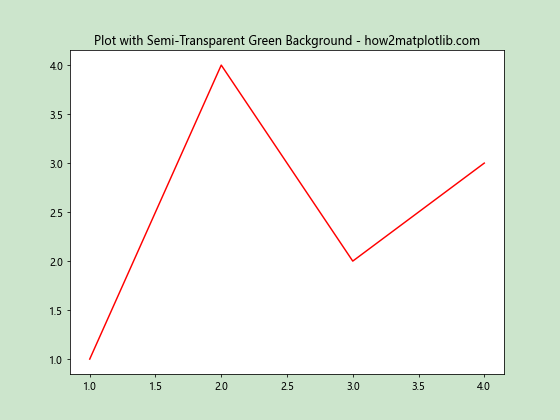
在这个例子中,我们首先设置背景色为绿色,然后通过fig.patch.set_alpha()方法设置透明度。
4. 动态更改背景色
有时,你可能需要在程序运行过程中动态更改图形的背景色。set_facecolor()方法允许你在任何时候更改背景色。
import matplotlib.pyplot as plt
import numpy as np

fig, ax = plt.subplots(figsize=(8, 6))

x = np.linspace(0, 10, 100)
y = np.sin(x)

line, = ax.plot(x, y)

for i in range(5):
    color = plt.cm.viridis(i/4)  # 使用viridis颜色映射
    fig.set_facecolor(color)
    ax.set_title(f'Sine Wave with Changing Background - how2matplotlib.com (Step {i+1})')
    plt.pause(1)

plt.show()
Output:
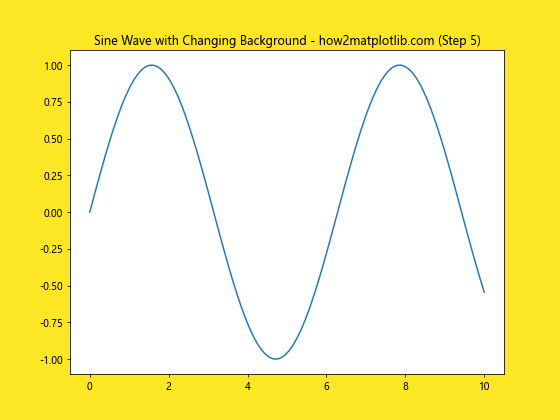
这个例子展示了如何在一个循环中动态更改背景色,创建一个简单的动画效果。
5. 结合其他样式设置
set_facecolor()方法通常与其他样式设置方法结合使用,以创建更加个性化和美观的图表。
5.1 设置轴的颜色
你可以设置轴的颜色以配合背景色:
import matplotlib.pyplot as plt

fig, ax = plt.subplots(figsize=(8, 6))
fig.set_facecolor('#F0F8FF')  # 爱丽丝蓝

ax.plot([1, 2, 3, 4], [1, 4, 2, 3], color='navy')
ax.set_facecolor('#E6E6FA')  # 淡紫色
ax.set_title('Plot with Different Figure and Axes Colors - how2matplotlib.com')

# 设置轴的颜色
ax.spines['bottom'].set_color('darkblue')
ax.spines['top'].set_color('darkblue')
ax.spines['left'].set_color('darkblue')
ax.spines['right'].set_color('darkblue')

plt.show()
Output:
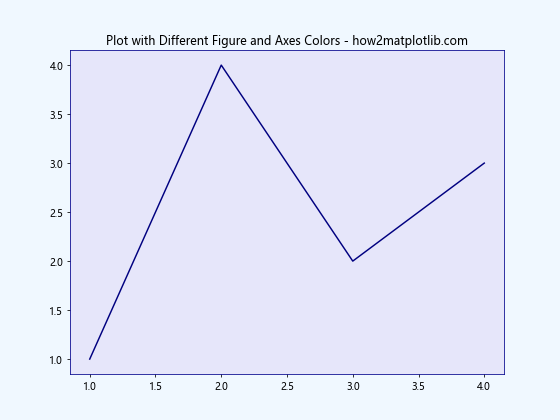
这个例子展示了如何为Figure和Axes设置不同的背景色,并调整轴的颜色以匹配整体设计。
5.2 使用样式表
Matplotlib提供了预定义的样式表,你可以结合set_facecolor()使用这些样式表:
import matplotlib.pyplot as plt

plt.style.use('seaborn')

fig, ax = plt.subplots(figsize=(8, 6))
fig.set_facecolor('#FFF0F5')  # 淡紫红色

ax.plot([1, 2, 3, 4], [1, 4, 2, 3], color='purple')
ax.set_title('Plot Using Seaborn Style with Custom Background - how2matplotlib.com')

plt.show()
在这个例子中,我们使用了’seaborn’样式,并自定义了Figure的背景色。
6. 在子图中使用set_facecolor()
当你创建包含多个子图的Figure时,你可以为整个Figure设置背景色,也可以为每个子图单独设置背景色。
import matplotlib.pyplot as plt

fig = plt.figure(figsize=(12, 8))
fig.set_facecolor('#F0F0F0')  # 浅灰色

ax1 = fig.add_subplot(221)
ax1.set_facecolor('#E6F3FF')  # 淡蓝色
ax1.plot([1, 2, 3, 4], [1, 4, 2, 3])
ax1.set_title('Subplot 1 - how2matplotlib.com')

ax2 = fig.add_subplot(222)
ax2.set_facecolor('#FFE6E6')  # 淡红色
ax2.scatter([1, 2, 3, 4], [1, 4, 2, 3])
ax2.set_title('Subplot 2 - how2matplotlib.com')

ax3 = fig.add_subplot(223)
ax3.set_facecolor('#E6FFE6')  # 淡绿色
ax3.bar([1, 2, 3, 4], [1, 4, 2, 3])
ax3.set_title('Subplot 3 - how2matplotlib.com')

ax4 = fig.add_subplot(224)
ax4.set_facecolor('#FFFFE6')  # 淡黄色
ax4.plot([1, 2, 3, 4], [1, 4, 2, 3], 'ro-')
ax4.set_title('Subplot 4 - how2matplotlib.com')

plt.tight_layout()
plt.show()
Output:

这个例子展示了如何在一个包含四个子图的Figure中,为每个子图设置不同的背景色。
7. 使用颜色映射(Colormap)
Matplotlib提供了丰富的颜色映射,你可以利用这些映射来创建更加复杂和美观的背景色效果。
import matplotlib.pyplot as plt
import numpy as np

fig, axes = plt.subplots(2, 2, figsize=(12, 10))
fig.set_facecolor('lightgray')

cmaps = ['viridis', 'plasma', 'inferno', 'magma']

for ax, cmap in zip(axes.flat, cmaps):
    # 创建一个渐变色背景
    x = np.linspace(0, 1, 100)
    y = np.linspace(0, 1, 100)
    X, Y = np.meshgrid(x, y)
    Z = X * Y

    im = ax.imshow(Z, cmap=plt.get_cmap(cmap), extent=[0, 10, 0, 10])
    ax.set_title(f'{cmap.capitalize()} Background - how2matplotlib.com')

    # 在渐变背景上绘制一些数据
    ax.plot(np.random.rand(10)*10, np.random.rand(10)*10, 'ko-')

plt.tight_layout()
plt.show()
Output:
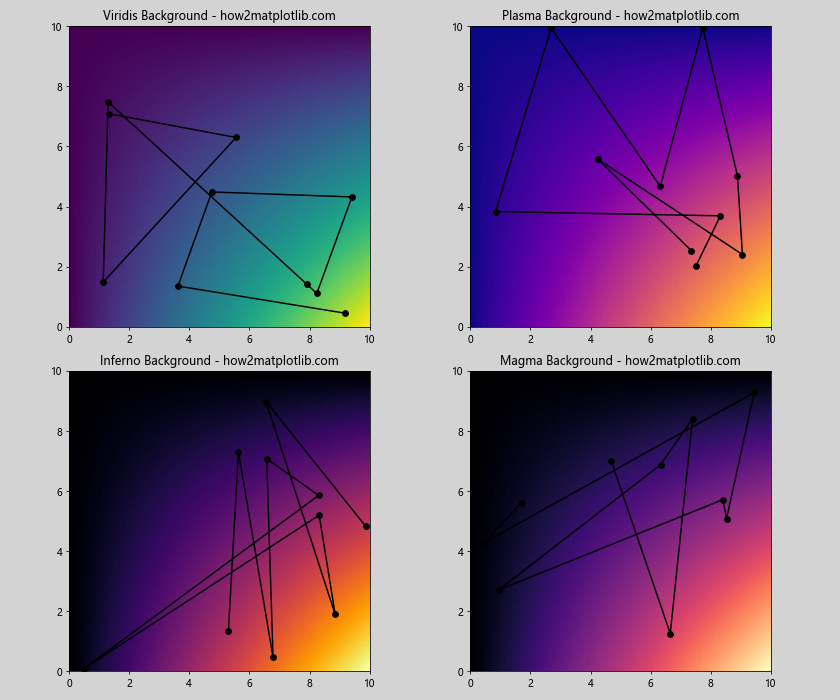
这个例子展示了如何使用不同的颜色映射来创建渐变背景,并在其上绘制数据。
8. 结合图例和注释
当你设置了自定义的背景色时,可能需要调整图例和注释的样式以确保它们清晰可见。
import matplotlib.pyplot as plt
import numpy as np

fig, ax = plt.subplots(figsize=(10, 6))
fig.set_facecolor('#E6E6FA')  # 淡紫色背景

x = np.linspace(0, 10, 100)
ax.plot(x, np.sin(x), label='Sine - how2matplotlib.com')
ax.plot(x, np.cos(x), label='Cosine - how2matplotlib.com')

ax.set_title('Trigonometric Functions', fontsize=16)
ax.set_xlabel('X axis', fontsize=12)
ax.set_ylabel('Y axis', fontsize=12)

# 自定义图例样式
legend = ax.legend(loc='upper right', facecolor='white', edgecolor='black')
legend.get_frame().set_alpha(0.8)

# 添加带有自定义背景的文本注释
ax.annotate('Important Point', xy=(np.pi, 1), xytext=(4, 0.8),
            arrowprops=dict(facecolor='black', shrink=0.05),
            bbox=dict(boxstyle="round,pad=0.3", fc="yellow", ec="black", alpha=0.8))

plt.show()
Output:
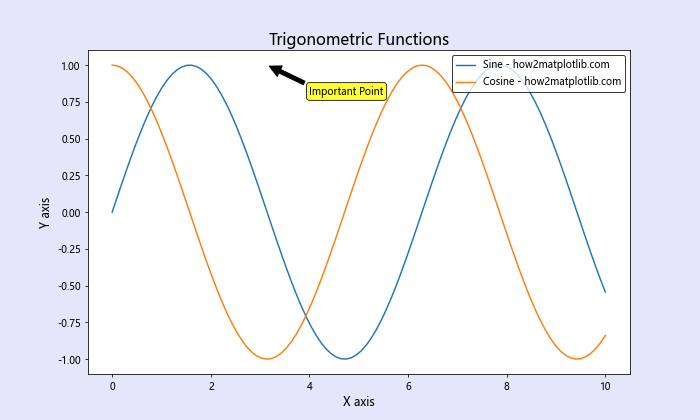
在这个例子中,我们为图例添加了白色背景和黑色边框,并为文本注释添加了黄色背景,以确保它们在紫色背景上清晰可见。
9. 在3D图形中使用set_facecolor()
set_facecolor()方法也可以用于3D图形,但效果可能会有所不同。
import matplotlib.pyplot as plt
import numpy as np
from mpl_toolkits.mplot3d import Axes3D

fig = plt.figure```python
fig = plt.figure(figsize=(10, 8))
fig.set_facecolor('#F0F8FF')  # 爱丽丝蓝

ax = fig.add_subplot(111, projection='3d')
ax.set_facecolor('#E6E6FA')  # 淡紫色

# 创建数据
x = np.linspace(-5, 5, 50)
y = np.linspace(-5, 5, 50)
X, Y = np.meshgrid(x, y)
Z = np.sin(np.sqrt(X**2 + Y**2))

# 绘制3D表面
surf = ax.plot_surface(X, Y, Z, cmap='viridis')

ax.set_title('3D Surface Plot with Custom Background - how2matplotlib.com')
ax.set_xlabel('X axis')
ax.set_ylabel('Y axis')
ax.set_zlabel('Z axis')

# 添加颜色条
fig.colorbar(surf, shrink=0.5, aspect=5)

plt.show()
在这个3D图形示例中,我们为Figure和Axes设置了不同的背景色。注意,在3D图形中,Axes的背景色可能不会完全覆盖整个绘图区域,因为3D投影的特性。
10. 在动画中使用set_facecolor()
set_facecolor()方法也可以在动画中使用,以创建动态变化的背景效果。
import matplotlib.pyplot as plt
import matplotlib.animation as animation
import numpy as np

fig, ax = plt.subplots(figsize=(8, 6))

x = np.linspace(0, 2*np.pi, 100)
line, = ax.plot(x, np.sin(x))

def animate(frame):
    line.set_ydata(np.sin(x + frame/10))
    # 根据帧数改变背景色
    color = plt.cm.viridis(frame / 100)
    fig.set_facecolor(color)
    ax.set_title(f'Animated Sine Wave - how2matplotlib.com (Frame {frame})')
    return line,

ani = animation.FuncAnimation(fig, animate, frames=100, interval=50, blit=True)
plt.show()
Output:
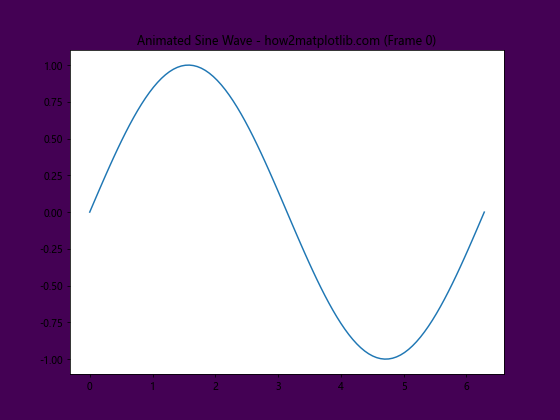
这个例子展示了如何在动画中动态改变背景色,创造出一种视觉上的流动效果。
11. 结合GridSpec使用set_facecolor()
当使用GridSpec创建复杂的子图布局时,你可以为整个Figure和各个子图分别设置背景色。
import matplotlib.pyplot as plt
import matplotlib.gridspec as gridspec
import numpy as np

fig = plt.figure(figsize=(12, 8))
fig.set_facecolor('#F5F5F5')  # 浅灰色

gs = gridspec.GridSpec(2, 3)

ax1 = fig.add_subplot(gs[0, :2])
ax1.set_facecolor('#E6F3FF')
ax1.plot(np.random.rand(50))
ax1.set_title('Subplot 1 - how2matplotlib.com')

ax2 = fig.add_subplot(gs[0, 2])
ax2.set_facecolor('#FFE6E6')
ax2.scatter(np.random.rand(20), np.random.rand(20))
ax2.set_title('Subplot 2 - how2matplotlib.com')

ax3 = fig.add_subplot(gs[1, :])
ax3.set_facecolor('#E6FFE6')
ax3.bar(range(10), np.random.rand(10))
ax3.set_title('Subplot 3 - how2matplotlib.com')

plt.tight_layout()
plt.show()
Output:

这个例子展示了如何在使用GridSpec创建的复杂布局中为不同的子图设置不同的背景色。
12. 在极坐标图中使用set_facecolor()
set_facecolor()方法同样适用于极坐标图。
import matplotlib.pyplot as plt
import numpy as np

fig = plt.figure(figsize=(8, 8))
fig.set_facecolor('#F0F0F0')  # 浅灰色

ax = fig.add_subplot(111, projection='polar')
ax.set_facecolor('#FFFAF0')  # 花白色

r = np.arange(0, 2, 0.01)
theta = 2 * np.pi * r

ax.plot(theta, r, color='red')
ax.set_title('Polar Plot with Custom Background - how2matplotlib.com')

plt.show()
Output:

这个例子展示了如何在极坐标图中设置背景色,为螺旋线图添加了美观的背景。
13. 使用set_facecolor()创建渐变背景
虽然set_facecolor()本身不支持直接创建渐变背景,但我们可以通过一些技巧来实现这个效果。
import matplotlib.pyplot as plt
import numpy as np

fig, ax = plt.subplots(figsize=(10, 6))

# 创建渐变背景
x = np.linspace(0, 1, 100)
y = np.linspace(0, 1, 100)
X, Y = np.meshgrid(x, y)
Z = Y  # 垂直渐变

plt.imshow(Z, extent=[0, 10, 0, 6], aspect='auto', cmap='Blues', alpha=0.5)

# 在渐变背景上绘制数据
ax.plot(np.random.rand(10)*10, np.random.rand(10)*6, 'ro-')
ax.set_title('Plot with Gradient Background - how2matplotlib.com')

plt.show()
Output:
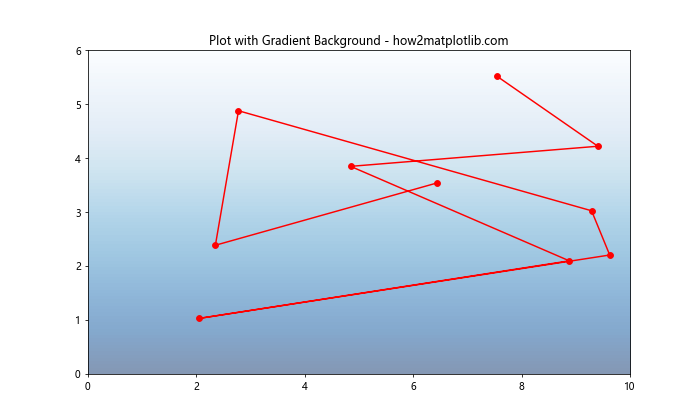
这个例子展示了如何创建一个简单的垂直渐变背景,并在其上绘制数据。
14. 在子图网格中使用set_facecolor()
当使用plt.subplots()创建子图网格时,你可以为每个子图单独设置背景色。
import matplotlib.pyplot as plt
import numpy as np

fig, axes = plt.subplots(2, 2, figsize=(12, 10))
fig.set_facecolor('#F0F0F0')  # 浅灰色

colors = ['#FFE6E6', '#E6FFE6', '#E6E6FF', '#FFFFE6']
for ax, color in zip(axes.flat, colors):
    ax.set_facecolor(color)
    x = np.linspace(0, 10, 100)
    ax.plot(x, np.sin(x * np.random.rand()))
    ax.set_title(f'Subplot with {color} background - how2matplotlib.com')

plt.tight_layout()
plt.show()
Output:
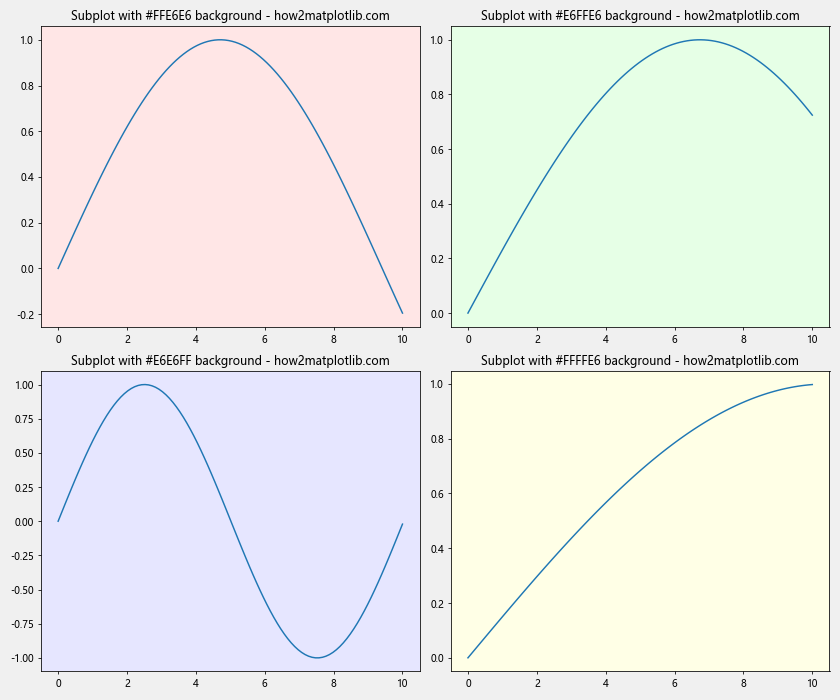
这个例子展示了如何在2×2的子图网格中为每个子图设置不同的背景色。
15. 结合颜色循环使用set_facecolor()
你可以结合Matplotlib的颜色循环来为多个图形设置不同的背景色。
import matplotlib.pyplot as plt
import numpy as np

# 创建一个自定义的颜色循环
colors = plt.cm.Set3(np.linspace(0, 1, 4))

fig, axes = plt.subplots(2, 2, figsize=(12, 10))
fig.set_facecolor('lightgray')

for ax, color in zip(axes.flat, colors):
    ax.set_facecolor(color)
    x = np.linspace(0, 10, 100)
    ax.plot(x, np.sin(x) * np.random.randn())
    ax.set_title(f'Plot with cycled background - how2matplotlib.com')

plt.tight_layout()
plt.show()
Output:
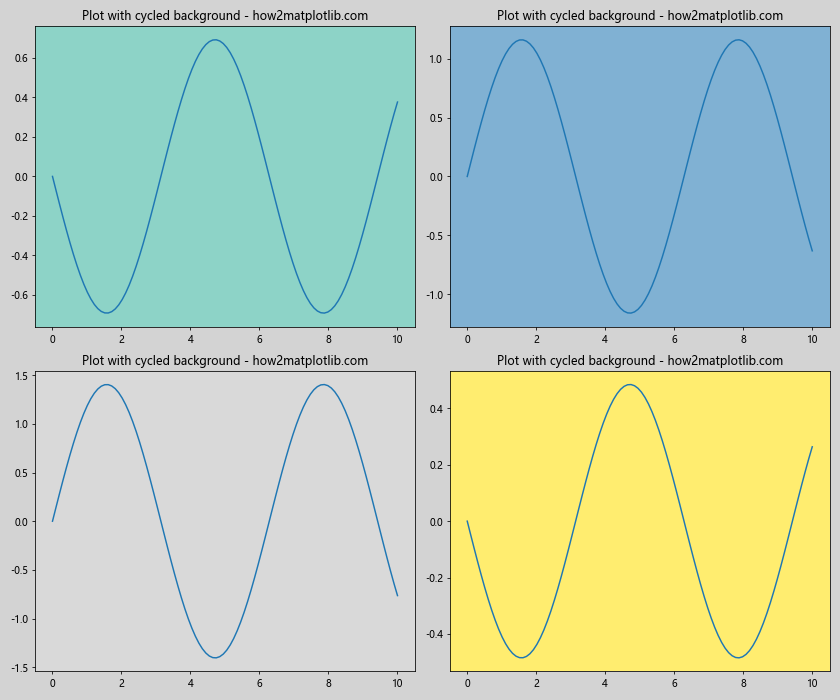
这个例子展示了如何使用颜色映射创建一个颜色循环,并将其应用于多个子图的背景。
结论
Figure.set_facecolor()是Matplotlib中一个强大而灵活的方法,允许用户自定义图形的背景色,从而增强数据可视化的美观性和可读性。通过本文的详细介绍和多个示例,我们探讨了该方法的多种用法,包括基本用法、颜色参数的多种形式、透明度设置、动态更改背景色、与其他样式设置的结合使用等。
无论是创建简单的单图还是复杂的多子图布局,set_facecolor()都能够灵活地应用,帮助你创建出既美观又专业的数据可视化图表。在实际应用中,合理使用背景色可以突出重要信息,改善图表的整体视觉效果,使得数据展示更加清晰和有吸引力。
记住,虽然自定义背景色可以增强图表的视觉吸引力,但过度使用可能会分散读者对数据本身的注意力。因此,在使用set_facecolor()时,应当权衡美观性和功能性,确保背景色的选择能够增强而不是干扰数据的呈现。通过实践和经验,你将能够掌握使用set_facecolor()创建既美观又有效的数据可视化图表的技巧。
 极客教程
极客教程